Singapore Airlines 2010 Annual Report Download - page 144
Download and view the complete annual report
Please find page 144 of the 2010 Singapore Airlines annual report below. You can navigate through the pages in the report by either clicking on the pages listed below, or by using the keyword search tool below to find specific information within the annual report.-
 1
1 -
2
-
3
-
4
-
5
-
6
-
7
-
8
-
9
-
10
-
11
-
12
-
13
-
14
-
15
-
16
-
17
-
18
-
19
-
20
-
21
-
22
-
23
-
24
-
25
-
26
-
27
-
28
-
29
-
30
-
31
-
32
-
33
-
34
-
35
-
36
-
37
-
38
-
39
-
40
-
41
-
42
-
43
-
44
-
45
-
46
-
47
-
48
-
49
-
50
-
51
-
52
-
53
-
54
-
55
-
56
-
57
-
58
-
59
-
60
-
61
-
62
-
63
-
64
-
65
-
66
-
67
-
68
-
69
-
70
-
71
-
72
-
73
-
74
-
75
-
76
-
77
-
78
-
79
-
80
-
81
-
82
-
83
-
84
-
85
-
86
-
87
-
88
-
89
-
90
-
91
-
92
-
93
-
94
-
95
-
96
-
97
-
98
-
99
-
100
-
101
-
102
-
103
-
104
-
105
-
106
-
107
-
108
-
109
-
110
-
111
-
112
-
113
-
114
-
115
-
116
-
117
-
118
-
119
-
120
-
121
-
122
-
123
-
124
-
125
-
126
-
127
-
128
-
129
-
130
-
131
-
132
-
133
-
 134
134 -
 135
135 -
 136
136 -
 137
137 -
 138
138 -
 139
139 -
 140
140 -
 141
141 -
 142
142 -
 143
143 -
 144
144 -
 145
145 -
 146
146 -
 147
147 -
 148
148 -
 149
149 -
 150
150 -
 151
151 -
 152
152 -
 153
153 -
 154
154 -
155
-
156
-
157
-
158
-
159
-
160
-
161
-
162
-
163
-
164
-
165
-
166
-
167
-
168
-
169
-
170
-
171
-
172
-
173
-
174
-
175
-
176
-
177
-
178
-
179
-
180
-
181
-
182
-
183
-
184
-
185
-
186
-
187
-
188
-
189
-
190
-
191
-
192
-
193
-
194
-
195
-
196
-
197
-
198
-
199
-
200
-
201
-
202
-
203
-
204
-
205
-
206
-
207
-
208
-
209
-
210
-
211
-
212
-
213
-
214
 |
 |

SINGAPORE AIRLINES
142
notes to the financial statements
31 march 2010
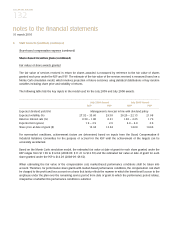
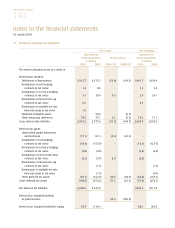
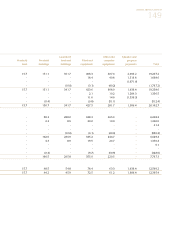
17 Deferred Taxation (in $ million)
The Group The Company
Statement of Statement of
financial position Profit and loss financial position
31 March 31 March
2010 2009 2009-10 2008-09 2010 2009
The deferred taxation arises as a result of:
Deferred tax liabilities
Differences in depreciation 2,315.7 2,412.5 (54.6) (138.5) 1,941.7 1,996.4
Revaluation of fuel hedging
contracts to fair value 1.2 0.6 - - 1.2 0.4
Revaluation of currency hedging
contracts to fair value 3.1 28.9 0.3 - 2.4 24.1
Revaluation of interest rate cap
contracts to fair value 0.7 - - - 0.7 -
Revaluation of available-for-sale
financial assets to fair value 1.0 - - - - -
Identified intangible assets - 56.5 - (0.7) - -
Other temporary differences 79.5 77.1 3.1 (5.5) 74.4 71.1
Gross deferred tax liabilities 2,401.2 2,575.6 (51.2) (144.7) 2,020.4 2,092.0
Deferred tax assets
Unabsorbed capital allowances
and tax losses (17.1) (31.1) (5.4) (22.4) - -
Revaluation of fuel hedging
contracts to fair value (19.3) (153.0) - - (16.1) (125.7)
Revaluation of currency hedging
contracts to fair value (2.9) (2.8) - - (2.5) (2.0)
Revaluation of interest rate swap
contracts to fair value (2.2) (2.4) 2.0 - (2.2) -
Revaluation of interest rate cap
contracts to fair value - (1.3) - - - (1.3)
Revaluation of available-for-sale
financial assets to fair value - (1.0) - - - (0.4)
Other deferred tax assets (63.1) (162.0) 94.5 (18.9) (54.0) (146.7)
Gross deferred tax assets (104.6) (353.6) 91.1 (41.3) (74.8) (276.1)
Net deferred tax liabilities 2,296.6 2,222.0 1,945.6 1,815.9
Deferred tax charged/(credited)
to profit and loss 39.9 (186.0)
Deferred tax charged/(credited) to equity 34.7 (134.1) 88.4 185.2