Singapore Airlines 2010 Annual Report Download - page 162
Download and view the complete annual report
Please find page 162 of the 2010 Singapore Airlines annual report below. You can navigate through the pages in the report by either clicking on the pages listed below, or by using the keyword search tool below to find specific information within the annual report.-
 1
1 -
2
-
3
-
4
-
5
-
6
-
7
-
8
-
9
-
10
-
11
-
12
-
13
-
14
-
15
-
16
-
17
-
18
-
19
-
20
-
21
-
22
-
23
-
24
-
25
-
26
-
27
-
28
-
29
-
30
-
31
-
32
-
33
-
34
-
35
-
36
-
37
-
38
-
39
-
40
-
41
-
42
-
43
-
44
-
45
-
46
-
47
-
48
-
49
-
50
-
51
-
52
-
53
-
54
-
55
-
56
-
57
-
58
-
59
-
60
-
61
-
62
-
63
-
64
-
65
-
66
-
67
-
68
-
69
-
70
-
71
-
72
-
73
-
74
-
75
-
76
-
77
-
78
-
79
-
80
-
81
-
82
-
83
-
84
-
85
-
86
-
87
-
88
-
89
-
90
-
91
-
92
-
93
-
94
-
95
-
96
-
97
-
98
-
99
-
100
-
101
-
102
-
103
-
104
-
105
-
106
-
107
-
108
-
109
-
110
-
111
-
112
-
113
-
114
-
115
-
116
-
117
-
118
-
119
-
120
-
121
-
122
-
123
-
124
-
125
-
126
-
127
-
128
-
129
-
130
-
131
-
132
-
133
-
134
-
135
-
136
-
137
-
138
-
139
-
140
-
141
-
142
-
143
-
144
-
145
-
146
-
147
-
148
-
149
-
150
-
151
-
 152
152 -
 153
153 -
 154
154 -
 155
155 -
 156
156 -
 157
157 -
 158
158 -
 159
159 -
 160
160 -
 161
161 -
 162
162 -
 163
163 -
 164
164 -
 165
165 -
 166
166 -
 167
167 -
 168
168 -
 169
169 -
 170
170 -
 171
171 -
 172
172 -
173
-
174
-
175
-
176
-
177
-
178
-
179
-
180
-
181
-
182
-
183
-
184
-
185
-
186
-
187
-
188
-
189
-
190
-
191
-
192
-
193
-
194
-
195
-
196
-
197
-
198
-
199
-
200
-
201
-
202
-
203
-
204
-
205
-
206
-
207
-
208
-
209
-
210
-
211
-
212
-
213
-
214
 |
 |

SINGAPORE AIRLINES
160
notes to the financial statements
31 march 2010
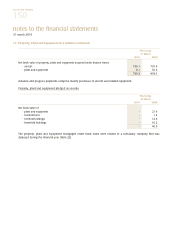
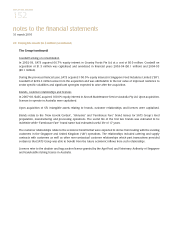
23 Associated Companies (in $ million) (continued)
The customer-related intangible assets arose from SATS’ acquisition of associated companies. SATS had engaged an
independent third party to perform a fair valuation of these separately identified intangible assets. The useful life of
these intangible assets was determined to be five years and the assets will be amortised on a straight-line basis over
the useful life. The amortisation is included in the line of share of profits of associated companies in the consolidated
profit and loss account. Subsequent to the disposal of SATS, there are nil balances for the intangible assets and related
accumulated amortisation.
Loans to associated companies are unsecured and have no foreseeable terms of repayments. Accordingly, the
fair values of the loans are not determinable as the timing of future cash flows arising from the loans cannot be
estimated reliably.
Loans to associated companies of $4.5 million were repaid during the financial year.
An amount of $133.0 million, which was previously recorded as a loan, has been reclassified as cost of investment.
This amount represents cumulative redeemable preference shares issued by Virgin Atlantic Limited (“VAL”).
On 20 October 2009, the terms and conditions of the cumulative preference shares were changed to remove the
automatic right of the preference shareholders to receive cumulative dividends and VAL had accordingly reclassified
the liability in their books to share capital.
The cumulative redeemable preference shares carry no entitlement to vote at meetings. On a winding up of VAL, the
preference shareholders have a right to receive, in preference to payments to ordinary shareholders, the amount paid
up on any share including any amount paid up by way of share premium plus any arrears or accruals of dividend
declared but not paid on the due date.
Amounts owing to/by associated companies are unsecured, trade-related, non-interest bearing and are repayable
on demand.
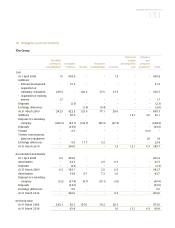
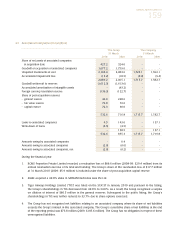
The summarised financial information of the associated companies, not adjusted for the proportion of ownership
interest held by the Group, are as follows:
The Group
31 March
2010 2009
Assets and liabilities
Current assets 2,969.5 3,833.7
Non-current assets 1,969.1 2,661.3
4,938.6 6,495.0
Current liabilities (2,308.2) (3,976.4)
Non-current liabilities (1,127.3) (1,197.1)
(3,435.5) (5,173.5)
2009-10 2008-09
Results
Revenue 6,364.2 7,702.1
Loss for the period (25.8) (28.2)