Singapore Airlines 2010 Annual Report Download - page 190
Download and view the complete annual report
Please find page 190 of the 2010 Singapore Airlines annual report below. You can navigate through the pages in the report by either clicking on the pages listed below, or by using the keyword search tool below to find specific information within the annual report.-
 1
1 -
2
-
3
-
4
-
5
-
6
-
7
-
8
-
9
-
10
-
11
-
12
-
13
-
14
-
15
-
16
-
17
-
18
-
19
-
20
-
21
-
22
-
23
-
24
-
25
-
26
-
27
-
28
-
29
-
30
-
31
-
32
-
33
-
34
-
35
-
36
-
37
-
38
-
39
-
40
-
41
-
42
-
43
-
44
-
45
-
46
-
47
-
48
-
49
-
50
-
51
-
52
-
53
-
54
-
55
-
56
-
57
-
58
-
59
-
60
-
61
-
62
-
63
-
64
-
65
-
66
-
67
-
68
-
69
-
70
-
71
-
72
-
73
-
74
-
75
-
76
-
77
-
78
-
79
-
80
-
81
-
82
-
83
-
84
-
85
-
86
-
87
-
88
-
89
-
90
-
91
-
92
-
93
-
94
-
95
-
96
-
97
-
98
-
99
-
100
-
101
-
102
-
103
-
104
-
105
-
106
-
107
-
108
-
109
-
110
-
111
-
112
-
113
-
114
-
115
-
116
-
117
-
118
-
119
-
120
-
121
-
122
-
123
-
124
-
125
-
126
-
127
-
128
-
129
-
130
-
131
-
132
-
133
-
134
-
135
-
136
-
137
-
138
-
139
-
140
-
141
-
142
-
143
-
144
-
145
-
146
-
147
-
148
-
149
-
150
-
151
-
152
-
153
-
154
-
155
-
156
-
157
-
158
-
159
-
160
-
161
-
162
-
163
-
164
-
165
-
166
-
167
-
168
-
169
-
170
-
171
-
172
-
173
-
174
-
175
-
176
-
177
-
178
-
179
-
 180
180 -
 181
181 -
 182
182 -
 183
183 -
 184
184 -
 185
185 -
 186
186 -
 187
187 -
 188
188 -
 189
189 -
 190
190 -
 191
191 -
 192
192 -
 193
193 -
 194
194 -
 195
195 -
 196
196 -
 197
197 -
 198
198 -
 199
199 -
 200
200 -
201
-
202
-
203
-
204
-
205
-
206
-
207
-
208
-
209
-
210
-
211
-
212
-
213
-
214
 |
 |

SINGAPORE AIRLINES
188
notes to the financial statements
31 march 2010
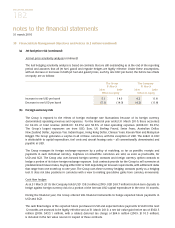
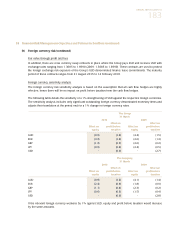
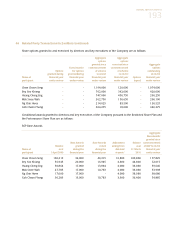
38 Financial Risk Management Objectives and Policies (in $ million) (continued)
(e) Liquidity risk (continued)
More
Within 1 - 2 2 - 3 3 - 4 4 - 5 than
1 year years years years years 5 years Total
2009
The Group
Notes payable 239.9 37.4 928.0 - - - 1,205.3
Finance lease commitments 85.2 87.3 89.2 91.1 91.8 188.5 633.1
Bank overdrafts 9.3 - - - - - 9.3
Loans 33.1 5.4 3.2 0.5 0.2 2.2 44.6
Trade and other creditors 2,616.2 - - - - - 2,616.2
Amounts owing to associated
companies 0.6 - - - - - 0.6
Derivative financial instruments:
Currency hedging contracts 14.5 - - - - - 14.5
Fuel hedging contracts 899.2 - - - - - 899.2
Cross currency swap contracts 29.8 - - - - - 29.8
Interest rate swap contracts 21.8 - - - - - 21.8
3,949.6 130.1 1,020.4 91.6 92.0 190.7 5,474.4
The Company
Notes payable 37.4 37.4 928.0 - - - 1,002.8
Trade and other creditors 1,940.4 - - - - - 1,940.4
Amounts owing to subsidiary
companies 1,597.8 - - - - - 1,597.8
Bank overdrafts 7.5 - - - - - 7.5
Derivative financial instruments:
Currency hedging contracts 11.8 - - - - - 11.8
Fuel hedging contracts 739.8 - - - - - 739.8
4,334.7 37.4 928.0 - - - 5,300.1