Singapore Airlines 2010 Annual Report Download - page 65
Download and view the complete annual report
Please find page 65 of the 2010 Singapore Airlines annual report below. You can navigate through the pages in the report by either clicking on the pages listed below, or by using the keyword search tool below to find specific information within the annual report.-
 1
1 -
2
-
3
-
4
-
5
-
6
-
7
-
8
-
9
-
10
-
11
-
12
-
13
-
14
-
15
-
16
-
17
-
18
-
19
-
20
-
21
-
22
-
23
-
24
-
25
-
26
-
27
-
28
-
29
-
30
-
31
-
32
-
33
-
34
-
35
-
36
-
37
-
38
-
39
-
40
-
41
-
42
-
43
-
44
-
45
-
46
-
47
-
48
-
49
-
50
-
51
-
52
-
53
-
54
-
 55
55 -
 56
56 -
 57
57 -
 58
58 -
 59
59 -
 60
60 -
 61
61 -
 62
62 -
 63
63 -
 64
64 -
 65
65 -
 66
66 -
 67
67 -
 68
68 -
 69
69 -
 70
70 -
 71
71 -
 72
72 -
 73
73 -
 74
74 -
 75
75 -
76
-
77
-
78
-
79
-
80
-
81
-
82
-
83
-
84
-
85
-
86
-
87
-
88
-
89
-
90
-
91
-
92
-
93
-
94
-
95
-
96
-
97
-
98
-
99
-
100
-
101
-
102
-
103
-
104
-
105
-
106
-
107
-
108
-
109
-
110
-
111
-
112
-
113
-
114
-
115
-
116
-
117
-
118
-
119
-
120
-
121
-
122
-
123
-
124
-
125
-
126
-
127
-
128
-
129
-
130
-
131
-
132
-
133
-
134
-
135
-
136
-
137
-
138
-
139
-
140
-
141
-
142
-
143
-
144
-
145
-
146
-
147
-
148
-
149
-
150
-
151
-
152
-
153
-
154
-
155
-
156
-
157
-
158
-
159
-
160
-
161
-
162
-
163
-
164
-
165
-
166
-
167
-
168
-
169
-
170
-
171
-
172
-
173
-
174
-
175
-
176
-
177
-
178
-
179
-
180
-
181
-
182
-
183
-
184
-
185
-
186
-
187
-
188
-
189
-
190
-
191
-
192
-
193
-
194
-
195
-
196
-
197
-
198
-
199
-
200
-
201
-
202
-
203
-
204
-
205
-
206
-
207
-
208
-
209
-
210
-
211
-
212
-
213
-
214
 |
 |

ANNUAL REPORT 2009/10
63
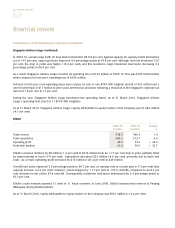
Performance of the Company (continued)
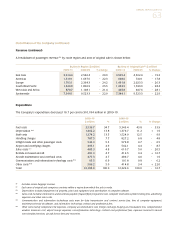
Revenue (continued)
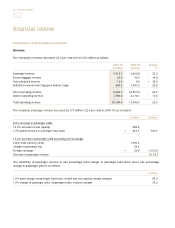
A breakdown of passenger revenue R8 by route region and area of original sale is shown below:
By Route Region ($ million) By Area of Original Sale R9 ($ million)
2009-10 2008-09 % Change 2009-10 2008-09 % Change
East Asia 2,014.4 2,546.4 - 20.9 3,525.4 4,362.4 - 19.2
Americas 1,319.1 1,697.6 - 22.3 608.6 740.1 - 17.8
Europe 1,793.1 2,364.3 - 24.2 1,491.8 2,023.3 - 26.3
South West Pacific 1,346.8 1,806.9 - 25.5 1,252.5 1,749.9 - 28.4
West Asia and Africa 870.7 1,108.1 - 21.4 465.8 647.6 - 28.1
Systemwide 7,344.1 9,523.3 - 22.9 7,344.1 9,523.3 - 22.9
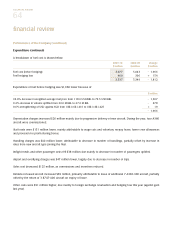
Expenditure
The Company’s expenditure decreased 16.7 per cent to $10,184 million in 2009-10.
2009-10 2008-09
$ million % $ million % % Change
Fuel costs 3,536.7 34.7 5,349.4 43.8 - 33.9
Depreciation R10 1,402.2 13.8 1,376.7 11.2 + 1.9
Staff costs 1,374.2 13.5 1,524.9 12.5 - 9.9
Handling charges 787.5 7.7 827.2 6.8 - 4.8
Inflight meals and other passenger costs 542.3 5.3 579.8 4.7 - 6.5
Airport and overflying charges 495.1 4.9 542.1 4.4 - 8.7
Sales costs R11 485.3 4.8 610.7 5.0 - 20.5
Rentals on leased aircraft 481.3 4.7 412.5 3.4 + 16.7
Aircraft maintenance and overhaul costs 477.3 4.7 486.7 4.0 - 1.9
Communication and information technology costs R12 95.5 0.9 101.8 0.8 - 6.2
Other costs R13 506.2 5.0 414.8 3.4 + 22.0
Total 10,183.6 100.0 12,226.6 100.0 - 16.7
R8 Includes excess baggage revenue.
R9 Each area of original sale comprises countries within a region from which the sale is made.
R10 Depreciation included impairment of property, plant and equipment and amortisation of computer software.
R11 Sales costs included commissions and incentives payable, frequent flyer programme cost, computer reservation system booking fees, advertising
expenses and other sales costs.
R12 Communication and information technology costs were for data transmission and contract service fees, hire of computer equipment,
maintenance/rental of software, and information technology contract and professional fees.
R13 Other costs mainly comprised crew expenses, company accommodation cost, foreign exchange hedging and revaluation loss, comprehensive
aviation insurance cost, airport lounge expenses, non-information technology contract and professional fees, expenses incurred to mount
non-scheduled services, aircraft licence fees and recoveries.