Singapore Airlines 2010 Annual Report Download - page 56
Download and view the complete annual report
Please find page 56 of the 2010 Singapore Airlines annual report below. You can navigate through the pages in the report by either clicking on the pages listed below, or by using the keyword search tool below to find specific information within the annual report.-
 1
1 -
2
-
3
-
4
-
5
-
6
-
7
-
8
-
9
-
10
-
11
-
12
-
13
-
14
-
15
-
16
-
17
-
18
-
19
-
20
-
21
-
22
-
23
-
24
-
25
-
26
-
27
-
28
-
29
-
30
-
31
-
32
-
33
-
34
-
35
-
36
-
37
-
38
-
39
-
40
-
41
-
42
-
43
-
44
-
45
-
 46
46 -
 47
47 -
 48
48 -
 49
49 -
 50
50 -
 51
51 -
 52
52 -
 53
53 -
 54
54 -
 55
55 -
 56
56 -
 57
57 -
 58
58 -
 59
59 -
 60
60 -
 61
61 -
 62
62 -
 63
63 -
 64
64 -
 65
65 -
 66
66 -
67
-
68
-
69
-
70
-
71
-
72
-
73
-
74
-
75
-
76
-
77
-
78
-
79
-
80
-
81
-
82
-
83
-
84
-
85
-
86
-
87
-
88
-
89
-
90
-
91
-
92
-
93
-
94
-
95
-
96
-
97
-
98
-
99
-
100
-
101
-
102
-
103
-
104
-
105
-
106
-
107
-
108
-
109
-
110
-
111
-
112
-
113
-
114
-
115
-
116
-
117
-
118
-
119
-
120
-
121
-
122
-
123
-
124
-
125
-
126
-
127
-
128
-
129
-
130
-
131
-
132
-
133
-
134
-
135
-
136
-
137
-
138
-
139
-
140
-
141
-
142
-
143
-
144
-
145
-
146
-
147
-
148
-
149
-
150
-
151
-
152
-
153
-
154
-
155
-
156
-
157
-
158
-
159
-
160
-
161
-
162
-
163
-
164
-
165
-
166
-
167
-
168
-
169
-
170
-
171
-
172
-
173
-
174
-
175
-
176
-
177
-
178
-
179
-
180
-
181
-
182
-
183
-
184
-
185
-
186
-
187
-
188
-
189
-
190
-
191
-
192
-
193
-
194
-
195
-
196
-
197
-
198
-
199
-
200
-
201
-
202
-
203
-
204
-
205
-
206
-
207
-
208
-
209
-
210
-
211
-
212
-
213
-
214
 |
 |
SINGAPORE AIRLINES
54
financial review
Performance of the Group (continued)
Financial Position
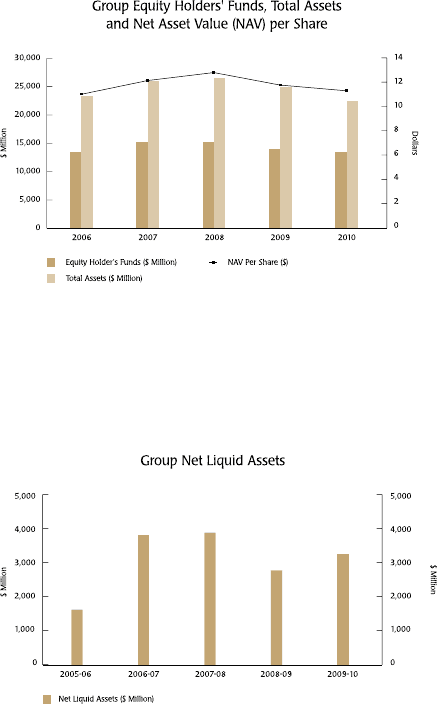
The Group’s total assets stood at $22,484 million as at 31 March 2010, down 9.4 per cent from a year ago, mainly as a
result of the divestment of SATS Group. Net asset value per share decreased 4.1 per cent to $11.30.
As at 31 March 2010, the Group’s equity attributable to equity holders of the Company decreased 3.3 per cent to $13,469
million. The decrease mainly arose from deconsolidation of SATS Group upon distribution of the dividend in specie and
payment of dividends during the year. This was partially offset by profit for the year and an increase in fair value reserve.
During the year, dividends paid pertained to final dividend of 20 cents per share in respect of financial year 2008-09.
The Group’s net liquid assets R3 position increased from $2,802 million a year ago to $3,274 million (+$472 million) as
at 31 March 2010, a result of cash generated from operations and deconsolidation of SATS Group (Included in last year’s
debt was an amount of $200.0 million which pertained to notes payable issued by SATS Group). Total debt to equity ratio
at 0.10 times was lower by 0.02 times.
R3 Net liquid assets is defined as the sum of cash and bank balances (net of bank overdrafts), investments, loans to third parties, and net of
finance lease commitments, loans and fixed rate notes issued.