Singapore Airlines 2010 Annual Report Download - page 136
Download and view the complete annual report
Please find page 136 of the 2010 Singapore Airlines annual report below. You can navigate through the pages in the report by either clicking on the pages listed below, or by using the keyword search tool below to find specific information within the annual report.-
 1
1 -
2
-
3
-
4
-
5
-
6
-
7
-
8
-
9
-
10
-
11
-
12
-
13
-
14
-
15
-
16
-
17
-
18
-
19
-
20
-
21
-
22
-
23
-
24
-
25
-
26
-
27
-
28
-
29
-
30
-
31
-
32
-
33
-
34
-
35
-
36
-
37
-
38
-
39
-
40
-
41
-
42
-
43
-
44
-
45
-
46
-
47
-
48
-
49
-
50
-
51
-
52
-
53
-
54
-
55
-
56
-
57
-
58
-
59
-
60
-
61
-
62
-
63
-
64
-
65
-
66
-
67
-
68
-
69
-
70
-
71
-
72
-
73
-
74
-
75
-
76
-
77
-
78
-
79
-
80
-
81
-
82
-
83
-
84
-
85
-
86
-
87
-
88
-
89
-
90
-
91
-
92
-
93
-
94
-
95
-
96
-
97
-
98
-
99
-
100
-
101
-
102
-
103
-
104
-
105
-
106
-
107
-
108
-
109
-
110
-
111
-
112
-
113
-
114
-
115
-
116
-
117
-
118
-
119
-
120
-
121
-
122
-
123
-
124
-
125
-
 126
126 -
 127
127 -
 128
128 -
 129
129 -
 130
130 -
 131
131 -
 132
132 -
 133
133 -
 134
134 -
 135
135 -
 136
136 -
 137
137 -
 138
138 -
 139
139 -
 140
140 -
 141
141 -
 142
142 -
 143
143 -
 144
144 -
 145
145 -
 146
146 -
147
-
148
-
149
-
150
-
151
-
152
-
153
-
154
-
155
-
156
-
157
-
158
-
159
-
160
-
161
-
162
-
163
-
164
-
165
-
166
-
167
-
168
-
169
-
170
-
171
-
172
-
173
-
174
-
175
-
176
-
177
-
178
-
179
-
180
-
181
-
182
-
183
-
184
-
185
-
186
-
187
-
188
-
189
-
190
-
191
-
192
-
193
-
194
-
195
-
196
-
197
-
198
-
199
-
200
-
201
-
202
-
203
-
204
-
205
-
206
-
207
-
208
-
209
-
210
-
211
-
212
-
213
-
214
 |
 |

SINGAPORE AIRLINES
134
notes to the financial statements
31 march 2010
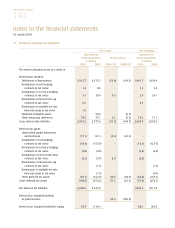
7 Finance Charges (in $ million)
The Group
2009-10 2008-09
Notes payable 39.9 43.4
Loans 0.8 0.7
Finance lease commitments 10.9 19.4
Other receivables measured at amortised cost 7.6 20.0
Realised loss on interest rate swap contracts accounted as cash flow hedges 9.5 3.9
Fair value (gain)/loss on interest rate swap contracts
accounted as fair value through profit and loss (2.1) 2.2
Commitment fees 2.3 0.1
68.9 89.7
8 Interest Income (in $ million)
The Group
2009-10 2008-09
Fixed deposits 19.3 70.8
Amortised interest income from other receivables 23.0 21.3
Others 7.2 3.9
49.5 96.0
9 Other Non-operating Items (in $ million)
The Group
2009-10 2008-09
Recognition of liquidated damages 20.4 39.0
Surplus on disposal of other property, plant and equipment 6.9 1.8
Amortisation of deferred gain/(loss) on sale and finance leaseback transactions 0.5 (0.5)
Gain on disposal of SATS shares 6.4 -
Impairment of investments - (9.8)
Loss on disposal of non-equity investments - (1.1)
34.2 29.4