Singapore Airlines 2010 Annual Report Download - page 54
Download and view the complete annual report
Please find page 54 of the 2010 Singapore Airlines annual report below. You can navigate through the pages in the report by either clicking on the pages listed below, or by using the keyword search tool below to find specific information within the annual report.-
 1
1 -
2
-
3
-
4
-
5
-
6
-
7
-
8
-
9
-
10
-
11
-
12
-
13
-
14
-
15
-
16
-
17
-
18
-
19
-
20
-
21
-
22
-
23
-
24
-
25
-
26
-
27
-
28
-
29
-
30
-
31
-
32
-
33
-
34
-
35
-
36
-
37
-
38
-
39
-
40
-
41
-
42
-
43
-
 44
44 -
 45
45 -
 46
46 -
 47
47 -
 48
48 -
 49
49 -
 50
50 -
 51
51 -
 52
52 -
 53
53 -
 54
54 -
 55
55 -
 56
56 -
 57
57 -
 58
58 -
 59
59 -
 60
60 -
 61
61 -
 62
62 -
 63
63 -
 64
64 -
65
-
66
-
67
-
68
-
69
-
70
-
71
-
72
-
73
-
74
-
75
-
76
-
77
-
78
-
79
-
80
-
81
-
82
-
83
-
84
-
85
-
86
-
87
-
88
-
89
-
90
-
91
-
92
-
93
-
94
-
95
-
96
-
97
-
98
-
99
-
100
-
101
-
102
-
103
-
104
-
105
-
106
-
107
-
108
-
109
-
110
-
111
-
112
-
113
-
114
-
115
-
116
-
117
-
118
-
119
-
120
-
121
-
122
-
123
-
124
-
125
-
126
-
127
-
128
-
129
-
130
-
131
-
132
-
133
-
134
-
135
-
136
-
137
-
138
-
139
-
140
-
141
-
142
-
143
-
144
-
145
-
146
-
147
-
148
-
149
-
150
-
151
-
152
-
153
-
154
-
155
-
156
-
157
-
158
-
159
-
160
-
161
-
162
-
163
-
164
-
165
-
166
-
167
-
168
-
169
-
170
-
171
-
172
-
173
-
174
-
175
-
176
-
177
-
178
-
179
-
180
-
181
-
182
-
183
-
184
-
185
-
186
-
187
-
188
-
189
-
190
-
191
-
192
-
193
-
194
-
195
-
196
-
197
-
198
-
199
-
200
-
201
-
202
-
203
-
204
-
205
-
206
-
207
-
208
-
209
-
210
-
211
-
212
-
213
-
214
 |
 |
SINGAPORE AIRLINES
52
financial review
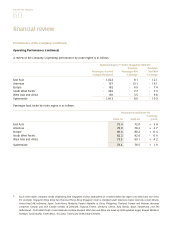
Key Financial Highlights
2009-10 2008-09 R1 % Change
Earnings For The Year ($ million)
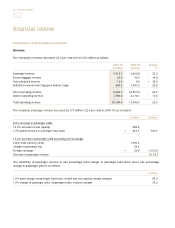
Revenue 12,707.3 15,996.3 - 20.6
Expenditure 12,644.1 15,092.7 - 16.2
Operating profit 63.2 903.6 - 93.0
Profit attributable to equity holders of the Company 215.8 1,061.5 R2 - 79.7
Per Share Data (cents)
Earnings per share – basic 18.2 89.6 - 79.7
Dividends per share 12.0 40.0 - 70.0
Ratios (%)
Return on equity holders’ funds 1.6 7.3 - 5.7 pts
Return on total assets 1.2 4.5 - 3.3 pts
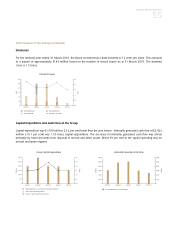
Group Earnings
The Group was impacted by the downturn in travel demand brought about by the global economic crisis, which began in late
2008. In the first half of the financial year, challenging business conditions resulted in sharp decline for both loads and yields,
causing the Group to incur a net loss attributable to equity holders of $466 million. As the recession began to ease in the second
half of the financial year, demand for both air travel and freight saw an upturn. With a strong second half recovery, the Group
returned to profitability (with a net profit attributable to equity holders of $682 million in the second half) and posted a full year
net profit attributable to equity holders of $216 million. This was $846 million lower (-79.7 per cent) than the preceding year.
Group revenue fell $3,289 million (-20.6 per cent) to $12,707 million. The decrease was mainly on account of significantly
lower airline and cargo operations as a result of the economic crisis. In addition, contribution from airport terminal and
food operations was lower, as SATS Group was deconsolidated from 1 September 2009, after completion of the dividend
in specie distribution. The Group’s revenue by business segment is shown below:
2009-10 2008-09
$ million $ million
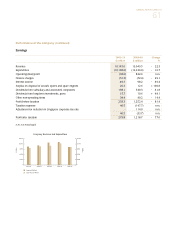
Airline operations 9,635.4 12,160.4
Cargo operations 2,288.2 2,965.7
Airport terminal and food operations 370.4 451.2
Engineering services 370.0 358.5
Others 43.3 60.5
Total revenue 12,707.3 15,996.3
R1 Singapore Airport Terminal Services Group (“SATS Group”) was deconsolidated from the Group with effect from 1 September 2009,
after completion of the dividend in specie distribution. For comparison purposes, a set of proforma financials for the previous financial year
(which have excluded SATS Group from 1 September 2008) is presented on page 58.
R2 Last year’s earnings included a one-off write-back of $138 million in prior years’ deferred tax provision following a reduction in the Singapore
corporate tax rate from 18 per cent to 17 per cent.
Performance of the Group