Singapore Airlines 2010 Annual Report Download - page 69
Download and view the complete annual report
Please find page 69 of the 2010 Singapore Airlines annual report below. You can navigate through the pages in the report by either clicking on the pages listed below, or by using the keyword search tool below to find specific information within the annual report.-
 1
1 -
2
-
3
-
4
-
5
-
6
-
7
-
8
-
9
-
10
-
11
-
12
-
13
-
14
-
15
-
16
-
17
-
18
-
19
-
20
-
21
-
22
-
23
-
24
-
25
-
26
-
27
-
28
-
29
-
30
-
31
-
32
-
33
-
34
-
35
-
36
-
37
-
38
-
39
-
40
-
41
-
42
-
43
-
44
-
45
-
46
-
47
-
48
-
49
-
50
-
51
-
52
-
53
-
54
-
55
-
56
-
57
-
58
-
 59
59 -
 60
60 -
 61
61 -
 62
62 -
 63
63 -
 64
64 -
 65
65 -
 66
66 -
 67
67 -
 68
68 -
 69
69 -
 70
70 -
 71
71 -
 72
72 -
 73
73 -
 74
74 -
 75
75 -
 76
76 -
 77
77 -
 78
78 -
 79
79 -
80
-
81
-
82
-
83
-
84
-
85
-
86
-
87
-
88
-
89
-
90
-
91
-
92
-
93
-
94
-
95
-
96
-
97
-
98
-
99
-
100
-
101
-
102
-
103
-
104
-
105
-
106
-
107
-
108
-
109
-
110
-
111
-
112
-
113
-
114
-
115
-
116
-
117
-
118
-
119
-
120
-
121
-
122
-
123
-
124
-
125
-
126
-
127
-
128
-
129
-
130
-
131
-
132
-
133
-
134
-
135
-
136
-
137
-
138
-
139
-
140
-
141
-
142
-
143
-
144
-
145
-
146
-
147
-
148
-
149
-
150
-
151
-
152
-
153
-
154
-
155
-
156
-
157
-
158
-
159
-
160
-
161
-
162
-
163
-
164
-
165
-
166
-
167
-
168
-
169
-
170
-
171
-
172
-
173
-
174
-
175
-
176
-
177
-
178
-
179
-
180
-
181
-
182
-
183
-
184
-
185
-
186
-
187
-
188
-
189
-
190
-
191
-
192
-
193
-
194
-
195
-
196
-
197
-
198
-
199
-
200
-
201
-
202
-
203
-
204
-
205
-
206
-
207
-
208
-
209
-
210
-
211
-
212
-
213
-
214
 |
 |

ANNUAL REPORT 2009/10
67
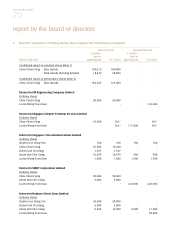
Performance of the Subsidiary Companies
The major subsidiary companies are SIA Engineering Company Limited (“SIAEC”), Singapore Airlines Cargo Pte Ltd (“SIA
Cargo”) and SilkAir (Singapore) Private Limited (“SilkAir”). The following performance review includes intra-group transactions.
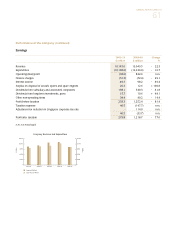
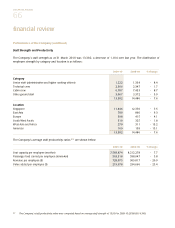
SIA Engineering Group
2009-10 2008-09 Change
$ million $ million %
Total revenue 1,006.4 1,045.3 - 3.7
Total expenditure 896.0 932.7 - 3.9
Operating profit 110.4 112.6 - 2.0
Profit attributable to equity holders of the Company 236.1 260.6 - 9.4
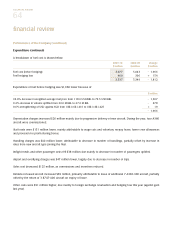
Revenue declined $39 million or 3.7 per cent to $1,006 million, mainly due to lower airframe and component
overhaul work and revenue from the turnkey project. This drop was partially mitigated by higher Fleet Management
Programme revenue.
Expenditure saw a reduction of $37 million or 3.9 per cent to $896 million. Staff and subcontract costs were lower as a
result of cost management initiatives.
As a result, SIAEC Group’s operating profit declined $2 million (-2.0 per cent) to $110 million.
Share of profits from associated and joint venture companies declined $43 million or 25.0 percent to $130 million.
This amounted to 49.4 per cent of the Group’s pre-tax profits. Surplus on disposal of fixed assets increased $6 million
while provision for tax fell $13 million or 34.5 per cent to $25 million.
The resting profit attributable to equity holders at the Company of $236 million for the financial year ended 31 March 2010
was $25 million lower (-9.4 per cent) than last year.
As at 31 March 2010, equity attributable to equity holders of the Company amounted to $1,265 million, $36 million
higher (+2.9 per cent) than at 31 March 2009. Net asset value per share of $1.17 was $0.03 higher (+2.6 per cent) than at
31 March 2009.
Basic earnings per share was 21.9 cents for the financial year ended 31 March 2010, a decrease of 2.3 cents per share
over last year.
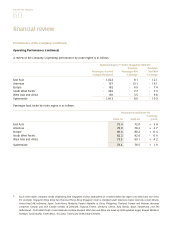
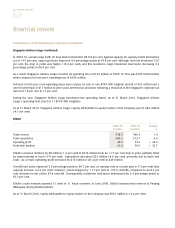
Singapore Airlines Cargo
2009-10 2008-09 Change
$ million $ million %
Total revenue 2,296.4 2,974.0 - 22.8
Total expenditure 2,441.5 3,219.0 - 24.2
Operating loss (145.1) (245.0) + 40.8
Loss after taxation (148.8) (153.9) + 3.3
Revenue decreased by $678 million (-22.8 per cent) due mainly to significant drop in yields. Expenditure fell $778 million
(-24.2 per cent), mainly as a result of lower fuel cost and variable costs from capacity reductions.