Singapore Airlines 2010 Annual Report Download - page 167
Download and view the complete annual report
Please find page 167 of the 2010 Singapore Airlines annual report below. You can navigate through the pages in the report by either clicking on the pages listed below, or by using the keyword search tool below to find specific information within the annual report.-
 1
1 -
2
-
3
-
4
-
5
-
6
-
7
-
8
-
9
-
10
-
11
-
12
-
13
-
14
-
15
-
16
-
17
-
18
-
19
-
20
-
21
-
22
-
23
-
24
-
25
-
26
-
27
-
28
-
29
-
30
-
31
-
32
-
33
-
34
-
35
-
36
-
37
-
38
-
39
-
40
-
41
-
42
-
43
-
44
-
45
-
46
-
47
-
48
-
49
-
50
-
51
-
52
-
53
-
54
-
55
-
56
-
57
-
58
-
59
-
60
-
61
-
62
-
63
-
64
-
65
-
66
-
67
-
68
-
69
-
70
-
71
-
72
-
73
-
74
-
75
-
76
-
77
-
78
-
79
-
80
-
81
-
82
-
83
-
84
-
85
-
86
-
87
-
88
-
89
-
90
-
91
-
92
-
93
-
94
-
95
-
96
-
97
-
98
-
99
-
100
-
101
-
102
-
103
-
104
-
105
-
106
-
107
-
108
-
109
-
110
-
111
-
112
-
113
-
114
-
115
-
116
-
117
-
118
-
119
-
120
-
121
-
122
-
123
-
124
-
125
-
126
-
127
-
128
-
129
-
130
-
131
-
132
-
133
-
134
-
135
-
136
-
137
-
138
-
139
-
140
-
141
-
142
-
143
-
144
-
145
-
146
-
147
-
148
-
149
-
150
-
151
-
152
-
153
-
154
-
155
-
156
-
 157
157 -
 158
158 -
 159
159 -
 160
160 -
 161
161 -
 162
162 -
 163
163 -
 164
164 -
 165
165 -
 166
166 -
 167
167 -
 168
168 -
 169
169 -
 170
170 -
 171
171 -
 172
172 -
 173
173 -
 174
174 -
 175
175 -
 176
176 -
 177
177 -
178
-
179
-
180
-
181
-
182
-
183
-
184
-
185
-
186
-
187
-
188
-
189
-
190
-
191
-
192
-
193
-
194
-
195
-
196
-
197
-
198
-
199
-
200
-
201
-
202
-
203
-
204
-
205
-
206
-
207
-
208
-
209
-
210
-
211
-
212
-
213
-
214
 |
 |

ANNUAL REPORT 2009/10
165
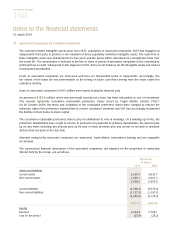
26 Other Non-Current Assets (in $ million)
The Group The Company
31 March 31 March
2010 2009 2010 2009
Other receivables 114.4 391.6 114.4 391.6
Investments in companies pending incorporation - 12.0 - -
114.4 403.6 114.4 391.6
The Group’s other receivables are stated at amortised cost and are expected to be received over a period of 2 to
10 years. As at 31 March 2010 and 31 March 2009, the entire balance of other receivables is denominated in USD.
The remaining non-current assets as at the end of the previous financial year was related to capital expenditure
incurred by SATS for the setting up of associated companies which were not legally incorporated as at 31 March 2009.
27 Inventories (in $ million)
The Group The Company
31 March 31 March
2010 2009 2010 2009
Technical stocks and stores 368.5 383.4 297.7 321.4
Catering and general stocks 17.1 70.8 12.1 17.3
Work-in-progress 43.9 49.0 - -
Total inventories at lower of cost and net realisable value 429.5 503.2 309.8 338.7
The cost of inventories recognised as an expense amounts to $106.6 million (2008-09: $107.7 million). In addition,
the Group wrote down $7.4 million (2008-09: $22.7 million) of inventories which are recognised as other operating
expenses in the profit and loss account.