Singapore Airlines 2010 Annual Report Download - page 155
Download and view the complete annual report
Please find page 155 of the 2010 Singapore Airlines annual report below. You can navigate through the pages in the report by either clicking on the pages listed below, or by using the keyword search tool below to find specific information within the annual report.-
 1
1 -
2
-
3
-
4
-
5
-
6
-
7
-
8
-
9
-
10
-
11
-
12
-
13
-
14
-
15
-
16
-
17
-
18
-
19
-
20
-
21
-
22
-
23
-
24
-
25
-
26
-
27
-
28
-
29
-
30
-
31
-
32
-
33
-
34
-
35
-
36
-
37
-
38
-
39
-
40
-
41
-
42
-
43
-
44
-
45
-
46
-
47
-
48
-
49
-
50
-
51
-
52
-
53
-
54
-
55
-
56
-
57
-
58
-
59
-
60
-
61
-
62
-
63
-
64
-
65
-
66
-
67
-
68
-
69
-
70
-
71
-
72
-
73
-
74
-
75
-
76
-
77
-
78
-
79
-
80
-
81
-
82
-
83
-
84
-
85
-
86
-
87
-
88
-
89
-
90
-
91
-
92
-
93
-
94
-
95
-
96
-
97
-
98
-
99
-
100
-
101
-
102
-
103
-
104
-
105
-
106
-
107
-
108
-
109
-
110
-
111
-
112
-
113
-
114
-
115
-
116
-
117
-
118
-
119
-
120
-
121
-
122
-
123
-
124
-
125
-
126
-
127
-
128
-
129
-
130
-
131
-
132
-
133
-
134
-
135
-
136
-
137
-
138
-
139
-
140
-
141
-
142
-
143
-
144
-
 145
145 -
 146
146 -
 147
147 -
 148
148 -
 149
149 -
 150
150 -
 151
151 -
 152
152 -
 153
153 -
 154
154 -
 155
155 -
 156
156 -
 157
157 -
 158
158 -
 159
159 -
 160
160 -
 161
161 -
 162
162 -
 163
163 -
 164
164 -
 165
165 -
166
-
167
-
168
-
169
-
170
-
171
-
172
-
173
-
174
-
175
-
176
-
177
-
178
-
179
-
180
-
181
-
182
-
183
-
184
-
185
-
186
-
187
-
188
-
189
-
190
-
191
-
192
-
193
-
194
-
195
-
196
-
197
-
198
-
199
-
200
-
201
-
202
-
203
-
204
-
205
-
206
-
207
-
208
-
209
-
210
-
211
-
212
-
213
-
214
 |
 |

ANNUAL REPORT 2009/10
153
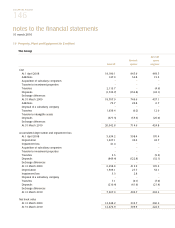
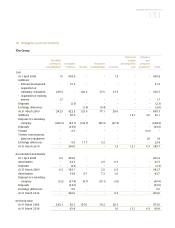
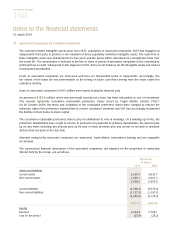
20 Intangible Assets (in $ million) (continued)
The Company
Computer software
31 March
2010 2009
Cost
At 1 April 308.2 293.0
Additions 15.9 15.2
Disposal (31.1) -
At 31 March 293.0 308.2
Accumulated amortisation
At 1 April 243.3 214.0
Amortisation 25.7 29.3
Disposal (31.0) -
At 31 March 238.0 243.3
Net book value 55.0 64.9
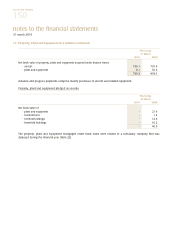
21 Investment Properties (in $ million)
The Group
31 March
2010 2009
Balance at 1 April 7.0 -
Transfer from property, plant and equipment - 7.3
Disposal of a subsidiary company (6.8) -
Depreciation (0.2) (0.3)
Balance at 31 March - 7.0
Cost - 16.3
Accumulated depreciation - (9.3)
Net book value - 7.0
The property rental income earned by the Group for the year ended 31 March 2010 from its investment properties
which are leased out under operating leases, amounted to $2.5 million (2008-09: $2.1 million).
Direct operating expenses (including repairs and maintenance) arising on rental-earning investment properties
amounted to $0.8 million (2008-09: $0.7 million).
The investment properties were related to SATS Group that was disposed during the financial year (Note 22). The Group
estimated the fair value of the investment properties as at 31 March 2009 to approximate the net book value.