Singapore Airlines 2010 Annual Report Download - page 68
Download and view the complete annual report
Please find page 68 of the 2010 Singapore Airlines annual report below. You can navigate through the pages in the report by either clicking on the pages listed below, or by using the keyword search tool below to find specific information within the annual report.-
 1
1 -
2
-
3
-
4
-
5
-
6
-
7
-
8
-
9
-
10
-
11
-
12
-
13
-
14
-
15
-
16
-
17
-
18
-
19
-
20
-
21
-
22
-
23
-
24
-
25
-
26
-
27
-
28
-
29
-
30
-
31
-
32
-
33
-
34
-
35
-
36
-
37
-
38
-
39
-
40
-
41
-
42
-
43
-
44
-
45
-
46
-
47
-
48
-
49
-
50
-
51
-
52
-
53
-
54
-
55
-
56
-
57
-
 58
58 -
 59
59 -
 60
60 -
 61
61 -
 62
62 -
 63
63 -
 64
64 -
 65
65 -
 66
66 -
 67
67 -
 68
68 -
 69
69 -
 70
70 -
 71
71 -
 72
72 -
 73
73 -
 74
74 -
 75
75 -
 76
76 -
 77
77 -
 78
78 -
79
-
80
-
81
-
82
-
83
-
84
-
85
-
86
-
87
-
88
-
89
-
90
-
91
-
92
-
93
-
94
-
95
-
96
-
97
-
98
-
99
-
100
-
101
-
102
-
103
-
104
-
105
-
106
-
107
-
108
-
109
-
110
-
111
-
112
-
113
-
114
-
115
-
116
-
117
-
118
-
119
-
120
-
121
-
122
-
123
-
124
-
125
-
126
-
127
-
128
-
129
-
130
-
131
-
132
-
133
-
134
-
135
-
136
-
137
-
138
-
139
-
140
-
141
-
142
-
143
-
144
-
145
-
146
-
147
-
148
-
149
-
150
-
151
-
152
-
153
-
154
-
155
-
156
-
157
-
158
-
159
-
160
-
161
-
162
-
163
-
164
-
165
-
166
-
167
-
168
-
169
-
170
-
171
-
172
-
173
-
174
-
175
-
176
-
177
-
178
-
179
-
180
-
181
-
182
-
183
-
184
-
185
-
186
-
187
-
188
-
189
-
190
-
191
-
192
-
193
-
194
-
195
-
196
-
197
-
198
-
199
-
200
-
201
-
202
-
203
-
204
-
205
-
206
-
207
-
208
-
209
-
210
-
211
-
212
-
213
-
214
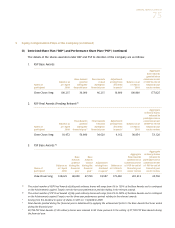
 |
 |

SINGAPORE AIRLINES
66
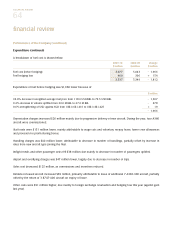
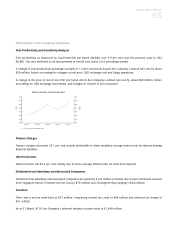
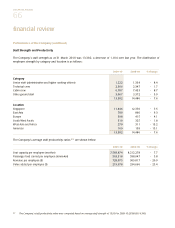
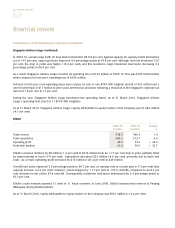
financial review
Performance of the Company (continued)
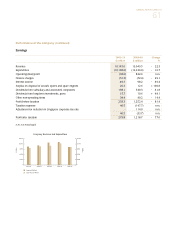
Staff Strength and Productivity
The Company’s staff strength as at 31 March 2010 was 13,382, a decrease of 1,104 over last year. The distribution of
employee strength by category and location is as follows:
2009-10 2008-09 % Change
Category
Senior staff (administrative and higher ranking officers) 1,222 1,334 - 8.4
Technical crew 2,306 2,347 - 1.7
Cabin crew 6,787 7,433 - 8.7
Other ground staff 3,067 3,372 - 9.0
13,382 14,486 - 7.6
Location
Singapore 11,446 12,376 - 7.5
East Asia 780 860 - 9.3
Europe 398 415 - 4.1
South West Pacific 319 325 - 1.8
West Asia and Africa 270 311 - 13.2
Americas 169 199 - 15.1
13,382 14,486 - 7.6
The Company’s average staff productivity ratios R14 are shown below:
2009-10 2008-09 % Change
Seat capacity per employee (seat-km) 7,583,874 8,212,278 - 7.7
Passenger load carried per employee (tonne-km) 563,318 598,047 - 5.8
Revenue per employee ($) 728,075 909,817 - 20.0
Value added per employee ($) 219,678 294,666 - 25.4
R14 The Company’s staff productivity ratios were computed based on average staff strength of 13,934 in 2009-10 (2008-09:14,343).