Singapore Airlines 2010 Annual Report Download - page 129
Download and view the complete annual report
Please find page 129 of the 2010 Singapore Airlines annual report below. You can navigate through the pages in the report by either clicking on the pages listed below, or by using the keyword search tool below to find specific information within the annual report.-
 1
1 -
2
-
3
-
4
-
5
-
6
-
7
-
8
-
9
-
10
-
11
-
12
-
13
-
14
-
15
-
16
-
17
-
18
-
19
-
20
-
21
-
22
-
23
-
24
-
25
-
26
-
27
-
28
-
29
-
30
-
31
-
32
-
33
-
34
-
35
-
36
-
37
-
38
-
39
-
40
-
41
-
42
-
43
-
44
-
45
-
46
-
47
-
48
-
49
-
50
-
51
-
52
-
53
-
54
-
55
-
56
-
57
-
58
-
59
-
60
-
61
-
62
-
63
-
64
-
65
-
66
-
67
-
68
-
69
-
70
-
71
-
72
-
73
-
74
-
75
-
76
-
77
-
78
-
79
-
80
-
81
-
82
-
83
-
84
-
85
-
86
-
87
-
88
-
89
-
90
-
91
-
92
-
93
-
94
-
95
-
96
-
97
-
98
-
99
-
100
-
101
-
102
-
103
-
104
-
105
-
106
-
107
-
108
-
109
-
110
-
111
-
112
-
113
-
114
-
115
-
116
-
117
-
118
-
 119
119 -
 120
120 -
 121
121 -
 122
122 -
 123
123 -
 124
124 -
 125
125 -
 126
126 -
 127
127 -
 128
128 -
 129
129 -
 130
130 -
 131
131 -
 132
132 -
 133
133 -
 134
134 -
 135
135 -
 136
136 -
 137
137 -
 138
138 -
 139
139 -
140
-
141
-
142
-
143
-
144
-
145
-
146
-
147
-
148
-
149
-
150
-
151
-
152
-
153
-
154
-
155
-
156
-
157
-
158
-
159
-
160
-
161
-
162
-
163
-
164
-
165
-
166
-
167
-
168
-
169
-
170
-
171
-
172
-
173
-
174
-
175
-
176
-
177
-
178
-
179
-
180
-
181
-
182
-
183
-
184
-
185
-
186
-
187
-
188
-
189
-
190
-
191
-
192
-
193
-
194
-
195
-
196
-
197
-
198
-
199
-
200
-
201
-
202
-
203
-
204
-
205
-
206
-
207
-
208
-
209
-
210
-
211
-
212
-
213
-
214
 |
 |

ANNUAL REPORT 2009/10
127
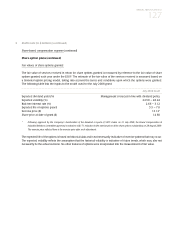
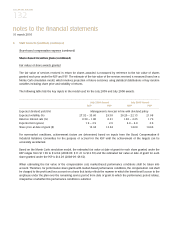
5 Staff Costs (in $ million) (continued)
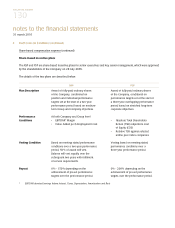
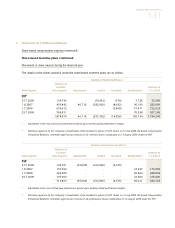
Share-based compensation expense (continued)
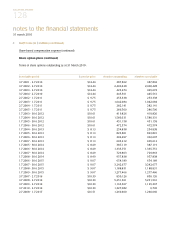
Share option plans (continued)
Fair values of share options granted
The fair value of services received in return for share options granted is measured by reference to the fair value of share
options granted each year under the ESOP. The estimate of the fair value of the services received is measured based on
a binomial option pricing model, taking into account the terms and conditions upon which the options were granted.
The following table lists the inputs to the model used for the July 2008 grant:
July 2008 Grant
Expected dividend yield (%) Management’s forecast in line with dividend policy
Expected volatility (%) 22.58 – 28.24
Risk-free interest rate (%) 2.66 – 3.12
Expected life of options (years) 5.5 – 7.0
Exercise price ($) 13.12*
Share price at date of grant ($) 14.60
* Following approval by the Company’s shareholders of the dividend in specie of SATS shares on 31 July 2009, the Board Compensation &
Industrial Relations Committee approved a reduction of $1.71 reduction in the exercise prices of the share options outstanding on 28 August 2009.
The exercise price reflected here is the exercise price after such adjustment.
The expected life of the options is based on historical data and is not necessarily indicative of exercise patterns that may occur.
The expected volatility reflects the assumption that the historical volatility is indicative of future trends, which may also not
necessarily be the actual outcome. No other features of options were incorporated into the measurement of fair value.