Singapore Airlines 2010 Annual Report Download - page 64
Download and view the complete annual report
Please find page 64 of the 2010 Singapore Airlines annual report below. You can navigate through the pages in the report by either clicking on the pages listed below, or by using the keyword search tool below to find specific information within the annual report.-
 1
1 -
2
-
3
-
4
-
5
-
6
-
7
-
8
-
9
-
10
-
11
-
12
-
13
-
14
-
15
-
16
-
17
-
18
-
19
-
20
-
21
-
22
-
23
-
24
-
25
-
26
-
27
-
28
-
29
-
30
-
31
-
32
-
33
-
34
-
35
-
36
-
37
-
38
-
39
-
40
-
41
-
42
-
43
-
44
-
45
-
46
-
47
-
48
-
49
-
50
-
51
-
52
-
53
-
 54
54 -
 55
55 -
 56
56 -
 57
57 -
 58
58 -
 59
59 -
 60
60 -
 61
61 -
 62
62 -
 63
63 -
 64
64 -
 65
65 -
 66
66 -
 67
67 -
 68
68 -
 69
69 -
 70
70 -
 71
71 -
 72
72 -
 73
73 -
 74
74 -
75
-
76
-
77
-
78
-
79
-
80
-
81
-
82
-
83
-
84
-
85
-
86
-
87
-
88
-
89
-
90
-
91
-
92
-
93
-
94
-
95
-
96
-
97
-
98
-
99
-
100
-
101
-
102
-
103
-
104
-
105
-
106
-
107
-
108
-
109
-
110
-
111
-
112
-
113
-
114
-
115
-
116
-
117
-
118
-
119
-
120
-
121
-
122
-
123
-
124
-
125
-
126
-
127
-
128
-
129
-
130
-
131
-
132
-
133
-
134
-
135
-
136
-
137
-
138
-
139
-
140
-
141
-
142
-
143
-
144
-
145
-
146
-
147
-
148
-
149
-
150
-
151
-
152
-
153
-
154
-
155
-
156
-
157
-
158
-
159
-
160
-
161
-
162
-
163
-
164
-
165
-
166
-
167
-
168
-
169
-
170
-
171
-
172
-
173
-
174
-
175
-
176
-
177
-
178
-
179
-
180
-
181
-
182
-
183
-
184
-
185
-
186
-
187
-
188
-
189
-
190
-
191
-
192
-
193
-
194
-
195
-
196
-
197
-
198
-
199
-
200
-
201
-
202
-
203
-
204
-
205
-
206
-
207
-
208
-
209
-
210
-
211
-
212
-
213
-
214
 |
 |

SINGAPORE AIRLINES
62
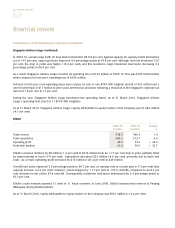
financial review
Performance of the Company (continued)
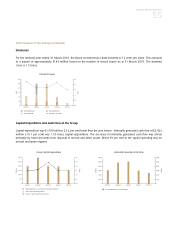
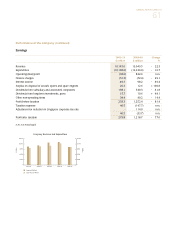
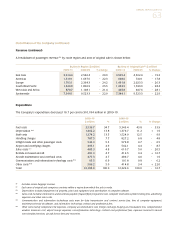
Revenue
The Company’s revenue decreased 22.3 per cent to $10,145 million as follows:
2009-10 2008-09 Change
$ million $ million %
Passenger revenue 7,318.1 9,492.8 - 22.9
Excess baggage revenue 26.0 30.5 - 14.8
Non-scheduled services 12.4 8.9 + 39.3
Bellyhold revenue from Singapore Airlines Cargo 999.5 1,347.2 - 25.8
Direct operating revenue 8,356.0 10,879.4 - 23.2
Indirect operating revenue 1,789.0 2,170.1 - 17.6
Total operating revenue 10,145.0 13,049.5 - 22.3
The Company’s passenger revenue decreased $2,175 million (-22.9 per cent) in 2009-10, as a result of:
$ million $ million
8.0% decrease in passenger traffic:
10.3% decrease in seat capacity - 982.0
1.9% points increase in passenger load factor + 219.3 - 762.7
16.2% decrease in passenger yield (excluding fuel surcharge):
Lower local currency yields - 1,399.6
Change in passenger mix - 32.4
Foreign exchange + 20.0 - 1,412.0
Decrease in passenger revenue - 2,174.7
The sensitivity of passenger revenue to one percentage point change in passenger load factor and a one percentage
change in passenger yield is as follows:
$ million
1.0% point change in passenger load factor, if yield and seat capacity remain constant 93.3
1.0% change in passenger yield, if passenger traffic remains constant 73.2