Singapore Airlines 2010 Annual Report Download - page 61
Download and view the complete annual report
Please find page 61 of the 2010 Singapore Airlines annual report below. You can navigate through the pages in the report by either clicking on the pages listed below, or by using the keyword search tool below to find specific information within the annual report.-
 1
1 -
2
-
3
-
4
-
5
-
6
-
7
-
8
-
9
-
10
-
11
-
12
-
13
-
14
-
15
-
16
-
17
-
18
-
19
-
20
-
21
-
22
-
23
-
24
-
25
-
26
-
27
-
28
-
29
-
30
-
31
-
32
-
33
-
34
-
35
-
36
-
37
-
38
-
39
-
40
-
41
-
42
-
43
-
44
-
45
-
46
-
47
-
48
-
49
-
50
-
 51
51 -
 52
52 -
 53
53 -
 54
54 -
 55
55 -
 56
56 -
 57
57 -
 58
58 -
 59
59 -
 60
60 -
 61
61 -
 62
62 -
 63
63 -
 64
64 -
 65
65 -
 66
66 -
 67
67 -
 68
68 -
 69
69 -
 70
70 -
 71
71 -
72
-
73
-
74
-
75
-
76
-
77
-
78
-
79
-
80
-
81
-
82
-
83
-
84
-
85
-
86
-
87
-
88
-
89
-
90
-
91
-
92
-
93
-
94
-
95
-
96
-
97
-
98
-
99
-
100
-
101
-
102
-
103
-
104
-
105
-
106
-
107
-
108
-
109
-
110
-
111
-
112
-
113
-
114
-
115
-
116
-
117
-
118
-
119
-
120
-
121
-
122
-
123
-
124
-
125
-
126
-
127
-
128
-
129
-
130
-
131
-
132
-
133
-
134
-
135
-
136
-
137
-
138
-
139
-
140
-
141
-
142
-
143
-
144
-
145
-
146
-
147
-
148
-
149
-
150
-
151
-
152
-
153
-
154
-
155
-
156
-
157
-
158
-
159
-
160
-
161
-
162
-
163
-
164
-
165
-
166
-
167
-
168
-
169
-
170
-
171
-
172
-
173
-
174
-
175
-
176
-
177
-
178
-
179
-
180
-
181
-
182
-
183
-
184
-
185
-
186
-
187
-
188
-
189
-
190
-
191
-
192
-
193
-
194
-
195
-
196
-
197
-
198
-
199
-
200
-
201
-
202
-
203
-
204
-
205
-
206
-
207
-
208
-
209
-
210
-
211
-
212
-
213
-
214
 |
 |
ANNUAL REPORT 2009/10
59
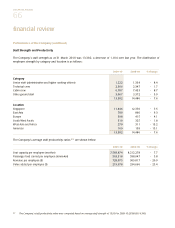
Performance of the Company
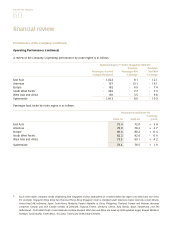
Operating Performance
2009-10 2008-09 % Change
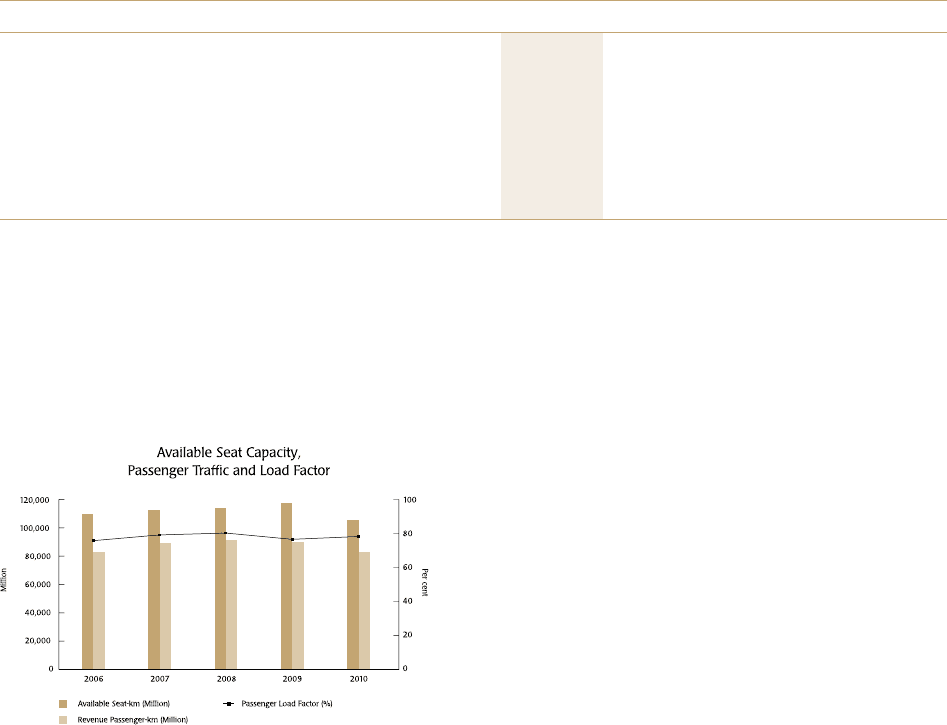
Passengers carried (thousand) 16,480 18,293 - 9.9
Available seat-km (million) 105,673.7 117,788.7 - 10.3
Revenue passenger-km (million) 82,882.5 90,128.1 - 8.0
Passenger load factor (%) 78.4 76.5 + 1.9 points
Passenger yield (¢/pkm) 10.4 12.5 - 16.8
Passenger unit cost (¢/ask) 8.6 9.2 - 6.5
Passenger breakeven load factor (%) 82.7 73.6 + 9.1 points
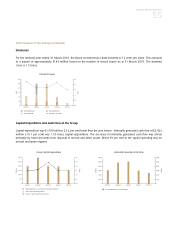
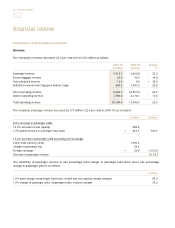
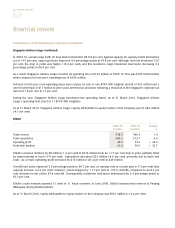
In 2009-10, the number of passengers carried by the Company fell 9.9 per cent. Passenger carriage (in revenue passenger-km) was
8.0 per cent lower year-on-year, at a slower pace than the reduction in capacity (in available seat-km) of 10.3 per cent. As a result,
passenger load factor increased 1.9 percentage points to 78.4 per cent.
Passenger yield fell 16.8 per cent, mainly attributable to intense competition and aggressive promotional fare activities, especially
in the first half of the financial year.