Singapore Airlines 2010 Annual Report Download - page 133
Download and view the complete annual report
Please find page 133 of the 2010 Singapore Airlines annual report below. You can navigate through the pages in the report by either clicking on the pages listed below, or by using the keyword search tool below to find specific information within the annual report.-
 1
1 -
2
-
3
-
4
-
5
-
6
-
7
-
8
-
9
-
10
-
11
-
12
-
13
-
14
-
15
-
16
-
17
-
18
-
19
-
20
-
21
-
22
-
23
-
24
-
25
-
26
-
27
-
28
-
29
-
30
-
31
-
32
-
33
-
34
-
35
-
36
-
37
-
38
-
39
-
40
-
41
-
42
-
43
-
44
-
45
-
46
-
47
-
48
-
49
-
50
-
51
-
52
-
53
-
54
-
55
-
56
-
57
-
58
-
59
-
60
-
61
-
62
-
63
-
64
-
65
-
66
-
67
-
68
-
69
-
70
-
71
-
72
-
73
-
74
-
75
-
76
-
77
-
78
-
79
-
80
-
81
-
82
-
83
-
84
-
85
-
86
-
87
-
88
-
89
-
90
-
91
-
92
-
93
-
94
-
95
-
96
-
97
-
98
-
99
-
100
-
101
-
102
-
103
-
104
-
105
-
106
-
107
-
108
-
109
-
110
-
111
-
112
-
113
-
114
-
115
-
116
-
117
-
118
-
119
-
120
-
121
-
122
-
 123
123 -
 124
124 -
 125
125 -
 126
126 -
 127
127 -
 128
128 -
 129
129 -
 130
130 -
 131
131 -
 132
132 -
 133
133 -
 134
134 -
 135
135 -
 136
136 -
 137
137 -
 138
138 -
 139
139 -
 140
140 -
 141
141 -
 142
142 -
 143
143 -
144
-
145
-
146
-
147
-
148
-
149
-
150
-
151
-
152
-
153
-
154
-
155
-
156
-
157
-
158
-
159
-
160
-
161
-
162
-
163
-
164
-
165
-
166
-
167
-
168
-
169
-
170
-
171
-
172
-
173
-
174
-
175
-
176
-
177
-
178
-
179
-
180
-
181
-
182
-
183
-
184
-
185
-
186
-
187
-
188
-
189
-
190
-
191
-
192
-
193
-
194
-
195
-
196
-
197
-
198
-
199
-
200
-
201
-
202
-
203
-
204
-
205
-
206
-
207
-
208
-
209
-
210
-
211
-
212
-
213
-
214
 |
 |
ANNUAL REPORT 2009/10
131
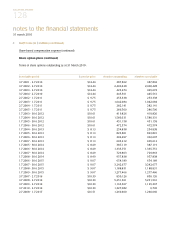
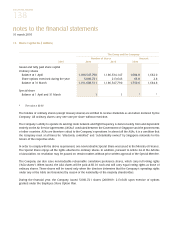
5 Staff Costs (in $ million) (continued)
Share-based compensation expense (continued)
Share-based incentive plans (continued)
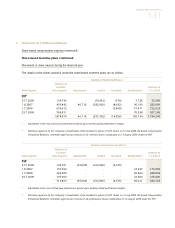
Movement of share awards during the financial year
The details of the shares awarded under the share-based incentive plans are as follows:
Number of Restricted Shares
Balance at
1.4.2009 / Balance at
Date of grant date of grant Adjustment* Vested Cancelled Modification# 31.3.2010
RSP
27.7.2006 139,749 - (74,432) (734) 7,726 72,309
1.8.2007 496,842 46,710 (282,960) (8,692) 30,199 282,099
1.7.2008 650,612 - - (5,400) 77,411 722,623
29.7.2009 586,811 - - - 70,398 657,209
1,874,014 46,710 (357,392) (14,826) 185,734 1,734,240
* Adjustment at the end of two-year performance period upon meeting stated performance targets.
# Following approval by the Company’s shareholders of the dividend in specie of SATS shares on 31 July 2009, the Board Compensation
& Industrial Relations Committee approved an increase in all restricted shares outstanding on 12 August 2009 under the RSP.
Number of Performance Shares
Balance at
1.4.2009 / Balance at
Date of grant date of grant Adjustment* Vested Cancelled Modification# 31.3.2010
PSP
27.7.2006 144,701 (35,000) (104,966) (4,735) - -
1.8.2007 157,952 - - - 18,947 176,899
1.7.2008 222,200 - - - 26,664 248,864
29.7.2009 195,000 - - - 23,400 218,400
719,853 (35,000) (104,966) (4,735) 69,011 644,163
* Adjustment at the end of three-year performance period upon meeting stated performance targets.
# Following approval by the Company’s shareholders of the dividend in specie of SATS shares on 31 July 2009, the Board Compensation
& Industrial Relations Committee approved an increase in all performance shares outstanding on 12 August 2009 under the PSP.