Singapore Airlines 2010 Annual Report Download - page 70
Download and view the complete annual report
Please find page 70 of the 2010 Singapore Airlines annual report below. You can navigate through the pages in the report by either clicking on the pages listed below, or by using the keyword search tool below to find specific information within the annual report.-
 1
1 -
2
-
3
-
4
-
5
-
6
-
7
-
8
-
9
-
10
-
11
-
12
-
13
-
14
-
15
-
16
-
17
-
18
-
19
-
20
-
21
-
22
-
23
-
24
-
25
-
26
-
27
-
28
-
29
-
30
-
31
-
32
-
33
-
34
-
35
-
36
-
37
-
38
-
39
-
40
-
41
-
42
-
43
-
44
-
45
-
46
-
47
-
48
-
49
-
50
-
51
-
52
-
53
-
54
-
55
-
56
-
57
-
58
-
59
-
 60
60 -
 61
61 -
 62
62 -
 63
63 -
 64
64 -
 65
65 -
 66
66 -
 67
67 -
 68
68 -
 69
69 -
 70
70 -
 71
71 -
 72
72 -
 73
73 -
 74
74 -
 75
75 -
 76
76 -
 77
77 -
 78
78 -
 79
79 -
 80
80 -
81
-
82
-
83
-
84
-
85
-
86
-
87
-
88
-
89
-
90
-
91
-
92
-
93
-
94
-
95
-
96
-
97
-
98
-
99
-
100
-
101
-
102
-
103
-
104
-
105
-
106
-
107
-
108
-
109
-
110
-
111
-
112
-
113
-
114
-
115
-
116
-
117
-
118
-
119
-
120
-
121
-
122
-
123
-
124
-
125
-
126
-
127
-
128
-
129
-
130
-
131
-
132
-
133
-
134
-
135
-
136
-
137
-
138
-
139
-
140
-
141
-
142
-
143
-
144
-
145
-
146
-
147
-
148
-
149
-
150
-
151
-
152
-
153
-
154
-
155
-
156
-
157
-
158
-
159
-
160
-
161
-
162
-
163
-
164
-
165
-
166
-
167
-
168
-
169
-
170
-
171
-
172
-
173
-
174
-
175
-
176
-
177
-
178
-
179
-
180
-
181
-
182
-
183
-
184
-
185
-
186
-
187
-
188
-
189
-
190
-
191
-
192
-
193
-
194
-
195
-
196
-
197
-
198
-
199
-
200
-
201
-
202
-
203
-
204
-
205
-
206
-
207
-
208
-
209
-
210
-
211
-
212
-
213
-
214
 |
 |

SINGAPORE AIRLINES
68
financial review
Performance of the Subsidiary Companies (continued)
Singapore Airlines Cargo (continued)
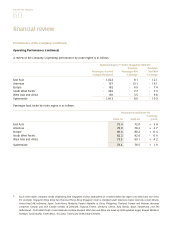
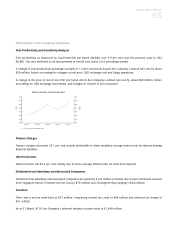
In 2009-10, overall cargo traffic (in load tonne kilometers) fell 8.8 per cent. Against capacity (in capacity tonne kilometers)
cut of 14.5 per cent, cargo load factor improved 4.0 percentage points to 63.4 per cent. Although unit cost decreased 12.0
per cent, the drop in yields was higher (-16.2 per cent), and this resulted in cargo breakeven load factor increasing 3.2
percentage points to 68.4 per cent.
As a result, Singapore Airlines Cargo recorded an operating loss of $145 million in 2009-10. This was $100 million better
when compared to last year’s operating loss of $245 million.
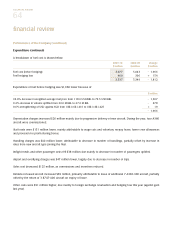
Included in last year’s non-operating items were surplus on sale of one B747-400 freighter aircraft of $52 million and a
one-off write-back of $17 million in prior years deferred tax provision following a reduction in the Singapore corporate tax
rate from 18 per cent to 17 per cent.
During the year, Singapore Airlines Cargo terminated two operating leases. As at 31 March 2010, Singapore Airlines
Cargo’s operating fleet stood at 11 B747-400 freighters.
As at 31 March 2010, Singapore Airlines Cargo’s equity attributable to equity holders of the Company was $1,682 million
(-4.1 per cent).
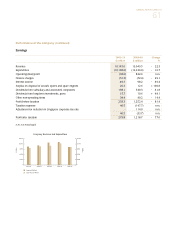
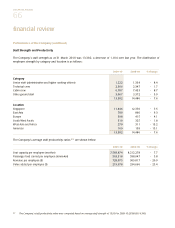
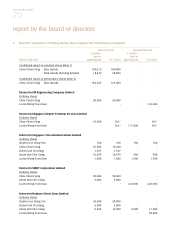
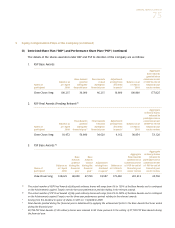
SilkAir
2009-10 2008-09 Change
$ million $ million %
Total revenue 538.5 546.3 - 1.4
Total expenditure 489.3 512.7 - 4.6
Operating profit 49.2 33.6 + 46.4
Profit after taxation 41.0 30.9 + 32.7
SilkAir’s revenue declined by $8 million (-1.4 per cent) to $539 million from an 11.7 per cent drop in yield, partially offset
by improvements in load (+7.9 per cent). Expenditure decreased $23 million (-4.6 per cent), primarily due to lower fuel
costs. As a result, operating profit increased by $16 million (+46.4 per cent) to $49 million.
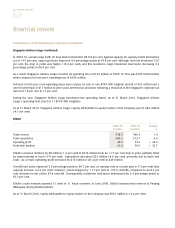
Overall load factor improved 3.5 percentage points to 64.7 per cent, as carriage rose at a faster pace (+7.9 per cent) than
capacity increase (+2.2 per cent). However, yields dropped by 11.7 per cent to 137.9 cents/ltk, compared to an 8.2 per
cent decrease in unit cost to 87.4 cents/ltk. Consequently, breakeven load factor deteriorated by 2.4 percentage points to
63.3 per cent.
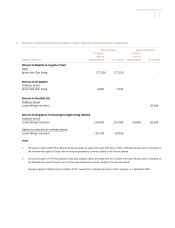
SilkAir’s route network spanned 31 cities in 11 Asian countries. In June 2009, SilkAir launched new services to Penang
(Malaysia) and Hyderabad (India).
As at 31 March 2010, equity attributable to equity holders of the Company was $501 million (+14.4 per cent).