Singapore Airlines 2010 Annual Report Download - page 128
Download and view the complete annual report
Please find page 128 of the 2010 Singapore Airlines annual report below. You can navigate through the pages in the report by either clicking on the pages listed below, or by using the keyword search tool below to find specific information within the annual report.-
 1
1 -
2
-
3
-
4
-
5
-
6
-
7
-
8
-
9
-
10
-
11
-
12
-
13
-
14
-
15
-
16
-
17
-
18
-
19
-
20
-
21
-
22
-
23
-
24
-
25
-
26
-
27
-
28
-
29
-
30
-
31
-
32
-
33
-
34
-
35
-
36
-
37
-
38
-
39
-
40
-
41
-
42
-
43
-
44
-
45
-
46
-
47
-
48
-
49
-
50
-
51
-
52
-
53
-
54
-
55
-
56
-
57
-
58
-
59
-
60
-
61
-
62
-
63
-
64
-
65
-
66
-
67
-
68
-
69
-
70
-
71
-
72
-
73
-
74
-
75
-
76
-
77
-
78
-
79
-
80
-
81
-
82
-
83
-
84
-
85
-
86
-
87
-
88
-
89
-
90
-
91
-
92
-
93
-
94
-
95
-
96
-
97
-
98
-
99
-
100
-
101
-
102
-
103
-
104
-
105
-
106
-
107
-
108
-
109
-
110
-
111
-
112
-
113
-
114
-
115
-
116
-
117
-
 118
118 -
 119
119 -
 120
120 -
 121
121 -
 122
122 -
 123
123 -
 124
124 -
 125
125 -
 126
126 -
 127
127 -
 128
128 -
 129
129 -
 130
130 -
 131
131 -
 132
132 -
 133
133 -
 134
134 -
 135
135 -
 136
136 -
 137
137 -
 138
138 -
139
-
140
-
141
-
142
-
143
-
144
-
145
-
146
-
147
-
148
-
149
-
150
-
151
-
152
-
153
-
154
-
155
-
156
-
157
-
158
-
159
-
160
-
161
-
162
-
163
-
164
-
165
-
166
-
167
-
168
-
169
-
170
-
171
-
172
-
173
-
174
-
175
-
176
-
177
-
178
-
179
-
180
-
181
-
182
-
183
-
184
-
185
-
186
-
187
-
188
-
189
-
190
-
191
-
192
-
193
-
194
-
195
-
196
-
197
-
198
-
199
-
200
-
201
-
202
-
203
-
204
-
205
-
206
-
207
-
208
-
209
-
210
-
211
-
212
-
213
-
214
 |
 |

SINGAPORE AIRLINES
126
notes to the financial statements
31 march 2010
5 Staff Costs (in $ million) (continued)
Share-based compensation expense (continued)
Share option plans (continued)
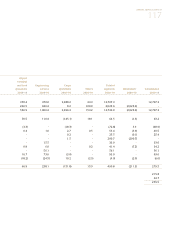
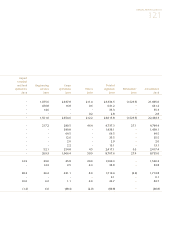
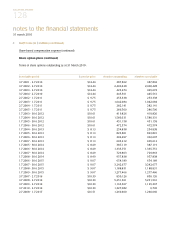
Movement of share options during the financial year
The following table illustrates the number and weighted average exercise prices of, and movements in, the ESOP during
the financial year:
2009-10 2008-09
Weighted Weighted
Number of average Number of average
options exercise price options exercise price
Balance at 1 April 63,383,492 $ 13.88 56,670,796 $13.53
Granted - - 12,836,062 $14.83
Cancelled (2,543,095) $ 13.21 (2,491,890) $14.28
Exercised (8,429,077) $ 11.68 (3,631,476) $11.51
Balance at 31 March 52,411,320 $ 9.22 63,383,492 $13.88
Exercisable at 31 March 37,888,409 $ 8.54 36,174,505 $12.57
The range of exercise prices for options outstanding at the end of the year is $8.13 to $16.51 (2008-09: $9.84 to $18.22).
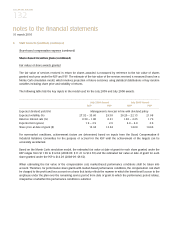
Following the expiry of the share option plans in March 2009, the Company ceased to grant options under ESOP.
The weighted average fair value of options granted during the previous financial year was $1.95. The weighted average
share price for options exercised during the year was $13.45 (2008-09: $13.23). The weighted average remaining
contractual life for these options is 5.75 years (2008-09: 6.21 years).