Singapore Airlines 2010 Annual Report Download - page 137
Download and view the complete annual report
Please find page 137 of the 2010 Singapore Airlines annual report below. You can navigate through the pages in the report by either clicking on the pages listed below, or by using the keyword search tool below to find specific information within the annual report.-
 1
1 -
2
-
3
-
4
-
5
-
6
-
7
-
8
-
9
-
10
-
11
-
12
-
13
-
14
-
15
-
16
-
17
-
18
-
19
-
20
-
21
-
22
-
23
-
24
-
25
-
26
-
27
-
28
-
29
-
30
-
31
-
32
-
33
-
34
-
35
-
36
-
37
-
38
-
39
-
40
-
41
-
42
-
43
-
44
-
45
-
46
-
47
-
48
-
49
-
50
-
51
-
52
-
53
-
54
-
55
-
56
-
57
-
58
-
59
-
60
-
61
-
62
-
63
-
64
-
65
-
66
-
67
-
68
-
69
-
70
-
71
-
72
-
73
-
74
-
75
-
76
-
77
-
78
-
79
-
80
-
81
-
82
-
83
-
84
-
85
-
86
-
87
-
88
-
89
-
90
-
91
-
92
-
93
-
94
-
95
-
96
-
97
-
98
-
99
-
100
-
101
-
102
-
103
-
104
-
105
-
106
-
107
-
108
-
109
-
110
-
111
-
112
-
113
-
114
-
115
-
116
-
117
-
118
-
119
-
120
-
121
-
122
-
123
-
124
-
125
-
126
-
 127
127 -
 128
128 -
 129
129 -
 130
130 -
 131
131 -
 132
132 -
 133
133 -
 134
134 -
 135
135 -
 136
136 -
 137
137 -
 138
138 -
 139
139 -
 140
140 -
 141
141 -
 142
142 -
 143
143 -
 144
144 -
 145
145 -
 146
146 -
 147
147 -
148
-
149
-
150
-
151
-
152
-
153
-
154
-
155
-
156
-
157
-
158
-
159
-
160
-
161
-
162
-
163
-
164
-
165
-
166
-
167
-
168
-
169
-
170
-
171
-
172
-
173
-
174
-
175
-
176
-
177
-
178
-
179
-
180
-
181
-
182
-
183
-
184
-
185
-
186
-
187
-
188
-
189
-
190
-
191
-
192
-
193
-
194
-
195
-
196
-
197
-
198
-
199
-
200
-
201
-
202
-
203
-
204
-
205
-
206
-
207
-
208
-
209
-
210
-
211
-
212
-
213
-
214
 |
 |

ANNUAL REPORT 2009/10
135
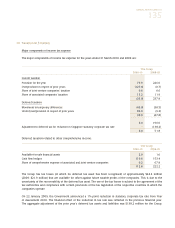
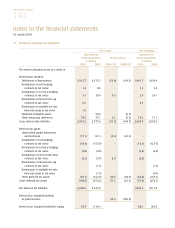
10 Taxation (in $ million)
Major components of income tax expense
The major components of income tax expense for the years ended 31 March 2010 and 2009 are:
The Group
2009-10 2008-09
Current taxation
Provision for the year 79.9 226.0
Overprovision in respect of prior years (127.6) (0.7)
Share of joint venture companies’ taxation 0.6 0.6
Share of associated companies’ taxation 13.2 11.9
(33.9) 237.8
Deferred taxation
Movement in temporary differences (43.0) (38.5)
Under/(over)provision in respect of prior years 82.9 (9.3)
39.9 (47.8)
6.0 190.0
Adjustment to deferred tax for reduction in Singapore statutory corporate tax rate - (138.2)
6.0 51.8
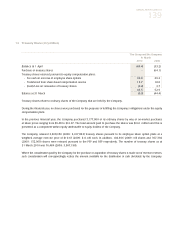
Deferred taxation related to other comprehensive income:
The Group
2009-10 2008-09
Available-for-sale financial assets 2.0 1.0
Cash flow hedges 110.6 153.4
Share of comprehensive expense of associated and joint venture companies 0.2 67.8
112.8 222.2
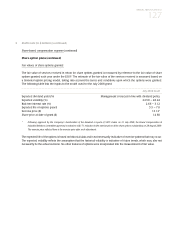
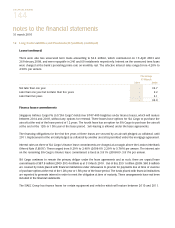
The Group has tax losses (of which no deferred tax asset has been recognised) of approximately $24.4 million
(2009: $21.9 million) that are available for offset against future taxable profits of the companies. This is due to the
uncertainty of the recoverability of the deferred tax asset. The use of the tax losses is subject to the agreement of the
tax authorities and compliance with certain provisions of the tax legislation of the respective countries in which the
companies operate.
On 22 January 2009, the Government announced a 1% point reduction in statutory corporate tax rate from Year
of Assessment 2010. The financial effect of the reduction in tax rate was reflected in the previous financial year.
The aggregate adjustment of the prior year’s deferred tax assets and liabilities was $138.2 million for the Group.