Qantas 2016 Annual Report Download - page 91
Download and view the complete annual report
Please find page 91 of the 2016 Qantas annual report below. You can navigate through the pages in the report by either clicking on the pages listed below, or by using the keyword search tool below to find specific information within the annual report.-
 1
1 -
2
-
3
-
4
-
5
-
6
-
7
-
8
-
9
-
10
-
11
-
12
-
13
-
14
-
15
-
16
-
17
-
18
-
19
-
20
-
21
-
22
-
23
-
24
-
25
-
26
-
27
-
28
-
29
-
30
-
31
-
32
-
33
-
34
-
35
-
36
-
37
-
38
-
39
-
40
-
41
-
42
-
43
-
44
-
45
-
46
-
47
-
48
-
49
-
50
-
51
-
52
-
53
-
54
-
55
-
56
-
57
-
58
-
59
-
60
-
61
-
62
-
63
-
64
-
65
-
66
-
67
-
68
-
69
-
70
-
71
-
72
-
73
-
74
-
75
-
76
-
77
-
78
-
79
-
80
-
 81
81 -
 82
82 -
 83
83 -
 84
84 -
 85
85 -
 86
86 -
 87
87 -
 88
88 -
 89
89 -
 90
90 -
 91
91 -
 92
92 -
 93
93 -
 94
94 -
 95
95 -
 96
96 -
 97
97 -
 98
98 -
 99
99 -
 100
100 -
 101
101 -
102
-
103
-
104
-
105
-
106
 |
 |

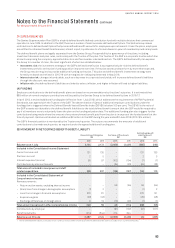
Notes to the Financial Statements continued
For the year ended 30 June 2016
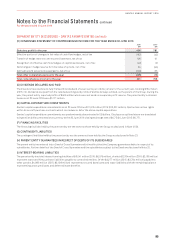
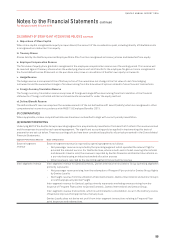
28 PARENT ENTITY DISCLOSURES – QANTAS AIRWAYS LIMITED CONTINUED
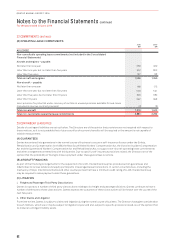
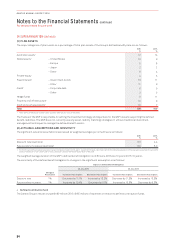
(C) CONDENSED STATEMENT OF COMPREHENSIVE INCOME FOR THE YEAR ENDED 30 JUNE 2016
2016
$M
2015
$M
Statutory profit for the year 406 781
Effective portion of changes in fair value of cash flow hedges, net of tax (187) (42)
Transfer of hedge reserve to the Income Statement, net of tax 196 91
Recognition of effective cash flow hedges on capitalised assets, net of tax (40) (2)
Net changes in hedge reserve for time value of options, net of tax 35 (95)
Defined benefit actuarial (losses)/gains, net of tax (209) 35
Total other comprehensive loss for the year (205) (13)
Total comprehensive income for the year 201 768
(D) DIVIDENDS DECLARED AND PAID
The Directors have declared a fully franked final dividend of seven cents per ordinary share for the current year, totalling $134 million
(2015: nil). Dividends are paid from the retained earnings and profits of Qantas Airways Limited, as the parent of the Group. During the
year, the parent entity reported profits of $406 million which were set aside in a separate profit reserve. The parent entity’s retained
losses as at 30 June 2016 were $1,171 million.
(E) CAPITAL EXPENDITURE COMMITMENTS
Qantas’ capital expenditure commitments as at 30 June 2016 are $11,612 million (2015: $10,051 million). Qantas has certain rights
within its aircraft purchase contracts which can reduce or defer the above capital expenditure.
Qantas’ capital expenditure commitments are predominantly denominated in US dollars. Disclosures outlined above are translated
to Australian dollar presentational currency at the 30 June 2016 closing exchange rate of $0.75 (30 June 2015: $0.77).
(F) FINANCING FACILITIES
The financing facilities held by the parent entity are the same as those held by the Group as disclosed in Note 21(B).
(G) CONTINGENT LIABILITIES
The contingent liabilities held by the parent entity are the same as those held by the Group as disclosed in Note 23.
(H) PARENT ENTITY GUARANTEES IN RESPECT OF DEBTS OF ITS SUBSIDIARIES
The parent entity has entered into a Deed of Cross Guarantee with the effect that the Company guarantees debts in respect of its
subsidiaries. Further details of the Deed of Cross Guarantee and the subsidiaries subject to the Deed are disclosed in Note 25.
(I) INTEREST-BEARING LIABILITIES
The parent entity has total interest-bearing liabilities of $6,041 million (2015: $6,979 million), of which $2,764 million (2015: $3,185 million)
represent lease and hire purchase liabilities payable to controlled entities. Of the $3,277 million (2015: $3,794 million) payable to
other parties, $1,985 million (2015: $2,128 million) represents secured bank loans and lease liabilities with the remaining balance
representing unsecured loans and deferred lease benefits.
89
QANTAS ANNUAL REPORT 2016