Qantas 2016 Annual Report Download - page 81
Download and view the complete annual report
Please find page 81 of the 2016 Qantas annual report below. You can navigate through the pages in the report by either clicking on the pages listed below, or by using the keyword search tool below to find specific information within the annual report.-
 1
1 -
2
-
3
-
4
-
5
-
6
-
7
-
8
-
9
-
10
-
11
-
12
-
13
-
14
-
15
-
16
-
17
-
18
-
19
-
20
-
21
-
22
-
23
-
24
-
25
-
26
-
27
-
28
-
29
-
30
-
31
-
32
-
33
-
34
-
35
-
36
-
37
-
38
-
39
-
40
-
41
-
42
-
43
-
44
-
45
-
46
-
47
-
48
-
49
-
50
-
51
-
52
-
53
-
54
-
55
-
56
-
57
-
58
-
59
-
60
-
61
-
62
-
63
-
64
-
65
-
66
-
67
-
68
-
69
-
70
-
 71
71 -
 72
72 -
 73
73 -
 74
74 -
 75
75 -
 76
76 -
 77
77 -
 78
78 -
 79
79 -
 80
80 -
 81
81 -
 82
82 -
 83
83 -
 84
84 -
 85
85 -
 86
86 -
 87
87 -
 88
88 -
 89
89 -
 90
90 -
 91
91 -
92
-
93
-
94
-
95
-
96
-
97
-
98
-
99
-
100
-
101
-
102
-
103
-
104
-
105
-
106
 |
 |

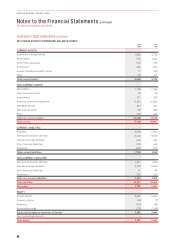
Notes to the Financial Statements continued
For the year ended 30 June 2016
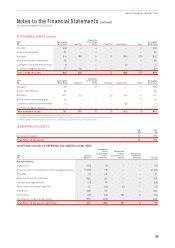
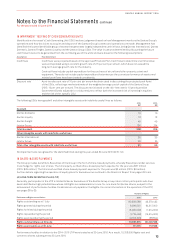
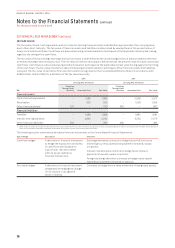
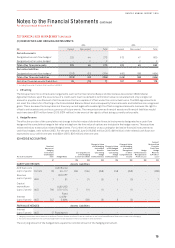
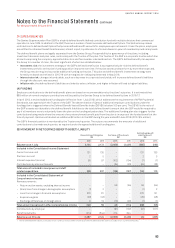
20 FINANCIAL RISK MANAGEMENT CONTINUED
(C) DERIVATIVES AND HEDGING INSTRUMENTS
2016 2015
$M Current Non-current Total Current Non-current Total
Derivative assets
Designated as cash flow hedges1229 44 273 613 47 660
Designated as fair value hedges1–22–22
Total other financial assets 229 46 275 613 49 662
Derivative liabilities
Designated as cash flow hedges1(203) (61) (264) (416) (68) (484)
Total other financial liabilities (203) (61) (264) (416) (68) (484)
Net other financial assets/(liabilities) 26 (15) 11 197 (19) 178
1 Including time value of options after transition to AASB 9.
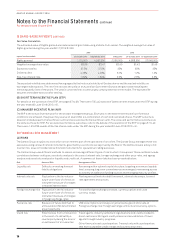
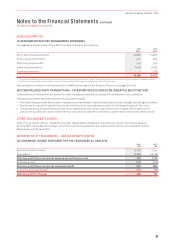
i. Offsetting
The Group enters into contractual arrangements such as the International Swaps and Derivatives Association (ISDA) Master
Agreement where, upon the occurrence of a credit event (such as default) a termination value is calculated and only a single net
amount is payable in settlement of all transactions that are capable of offset under the contractual terms. The ISDA agreements do
not meet the criteria for offsetting in the Consolidated Balance Sheet and consequently financial assets and liabilities are recognised
gross. This is because the Group does not have any current legal enforceable right to offset recognised amounts, because the right to
offset is enforceable only on the occurrence of future events. The amounts shown as financial assets and financial liabilities would
each have been $181 million lower (2015: $374 million) in the event of the right to offset being currently enforceable.
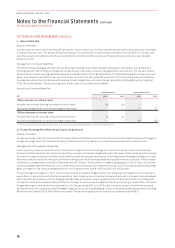
ii. Hedge Reserve
The effective portion of the cumulative net change in the fair value of derivative financial instruments designated as a cash flow
hedge and the cumulative change in fair value arising from the time value of options are included in the hedge reserve. These options
relate entirely to transaction related hedged items. For further information on accounting for derivative financial instruments as
cash flow hedges, refer to Note 29(E). For the year ended 30 June 2016, $95 million (2015: $96 million) of the related cash flows are
expected to occur within one year and $24m (2015: $26 million) after one year.
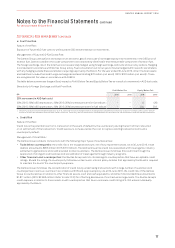
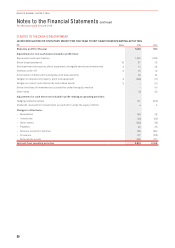
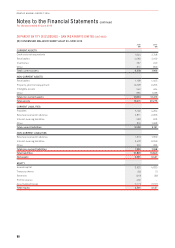
(D) HEDGE ACCOUNTING
As at 30 June 2016
Nominal
Amount of
Hedging
Instrument
and Hedged
Item Hedge Rates
Carrying Amount
of the Hedging
Instrument (AUD)1
Change in Value
of the Hedging
Instrument
Used for
Calculating
Hedge
Ineffectiveness
Change in Value
of the Hedged
Item Used for
Calculating
Hedge
Ineffectiveness
Change in Value
of the Hedging
Instrument
Recognised
in Other
Comprehensive
Income
Hedge
Ineffectiveness
Recognised in
Profit or Loss
Amount
Reclassified
From the
Cash Flow
Hedge
Reserve
to Profit or
Loss2
M$M $M $M $M $M $M $M
CASH FLOW HEDGES Assets Liabilities
AUD fuel costs
(up to 2 years) barrels 33
AUD/Barrel
50–117 266 (195) (258) 258 (258) –(288)
Revenue
(up to 2 years) AUD 7
AUD/JPY
81 –(7) (5) 5(5) – 7
Capital
expenditure
(up to 2 years) AUD 766
AUD/USD
0.70–0.74 7(11) (1) 1(1) – –
Interest
(up to 6 years) AUD 547
Fixed
4.40%–
5.99% –(58) (3) 3(3) – –
FAIR VALUE HEDGES Assets Liabilities
Interest
(up to 5 years) AUD 17 Floating n/a 2 – – – – – –
1 Hedging instruments are located within the Other Financial Assets and Other Financial Liabilities on the Consolidated Balance Sheet and include costs of hedging.
2 Amounts reclassified from the cash flow hedge reserve to fuel expense in the Consolidated Income Statement.
The carrying amount of the hedged item equals the nominal amount of the hedging instrument.
79
QANTAS ANNUAL REPORT 2016