Qantas 2016 Annual Report Download - page 39
Download and view the complete annual report
Please find page 39 of the 2016 Qantas annual report below. You can navigate through the pages in the report by either clicking on the pages listed below, or by using the keyword search tool below to find specific information within the annual report.-
 1
1 -
2
-
3
-
4
-
5
-
6
-
7
-
8
-
9
-
10
-
11
-
12
-
13
-
14
-
15
-
16
-
17
-
18
-
19
-
20
-
21
-
22
-
23
-
24
-
25
-
26
-
27
-
28
-
 29
29 -
 30
30 -
 31
31 -
 32
32 -
 33
33 -
 34
34 -
 35
35 -
 36
36 -
 37
37 -
 38
38 -
 39
39 -
 40
40 -
 41
41 -
 42
42 -
 43
43 -
 44
44 -
 45
45 -
 46
46 -
 47
47 -
 48
48 -
 49
49 -
50
-
51
-
52
-
53
-
54
-
55
-
56
-
57
-
58
-
59
-
60
-
61
-
62
-
63
-
64
-
65
-
66
-
67
-
68
-
69
-
70
-
71
-
72
-
73
-
74
-
75
-
76
-
77
-
78
-
79
-
80
-
81
-
82
-
83
-
84
-
85
-
86
-
87
-
88
-
89
-
90
-
91
-
92
-
93
-
94
-
95
-
96
-
97
-
98
-
99
-
100
-
101
-
102
-
103
-
104
-
105
-
106
 |
 |

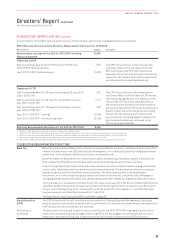
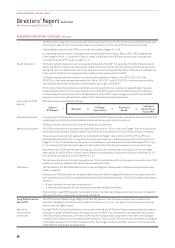
Directors’ Report continued
For the year ended 30 June 2016
REMUNERATION REPORT (AUDITED) CONTINUED
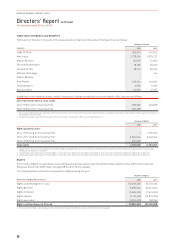
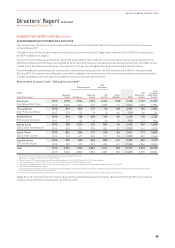
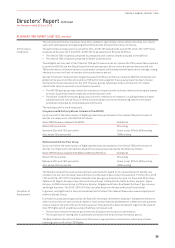
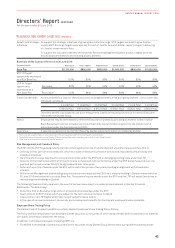
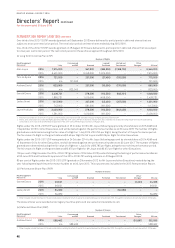
A reconciliation of the CEO’s remuneration outcome to the statutory disclosures is detailed below as an example.
CEO’s Remuneration Outcome to Statutory Remuneration Disclosure for 2015/2016
Reconciliation ($’000s) Description
Remuneration outcome for the CEO for 2015/2016 including
share price growth
12,960
Treatment of STIP
Add: Accounting value for 2012/13 STIP, 2014/15 STIP and
2015/16 STIP deferred awards
Less: 2015/16 STIP deferred award
836
(1,632)
The STIP amount shown in the remuneration
outcomes tables is the full value of both the
STIP cash bonus and STIP restricted shares
awarded (rather than amortising the accounting
values over the relevant performance and service
periods as per the accounting standards).
Treatment of LTIP
Add: Accounting value for LTIP award tested as at 30 June 2016
(2014–2016 LTIP)1
670 The LTIP amount shown in the remuneration
outcomes tables is the full value of LTIP awards
that vested during the year. It is made up of the
value of the LTIP driven by vesting based on
the share price at the start of the performance
period and value of the LTIP driven by share price
growth (rather than amortising the accounting
values over the relevant performance and
service periods not having regard to whetherthe
performance hurdles were achieved as per
theaccounting standards).
Add: Accounting value for LTIP award to be tested in a future
year (2015–2017 LTIP)2
1,112
Add: Accounting value for LTIP award to be tested in a future
year (2016–2018 LTIP)3
548
Less: 2014–2016 LTIP – vesting4(2,904)
Less: 2014–2016 LTIP – share price growth5(3,162)
Statutory Remuneration Disclosure for the CEO for 2015/2016 8,428
1 The 2014–2016 LTIP was tested as at 30 June 2016. 100 per cent of Rights vested.
2 The 2015–2017 LTIP is due to be tested as at 30 June 2017. The Qantas share price at the start of the performance period (1 July 2014) was $1.26.
3 The 2016–2018 LTIP is due to be tested as at 30 June 2018. The Qantas share price at the start of the performance period (1 July 2015) was $3.16.
4 The number of Rights vested multiplied by the Qantas share price at the start of the performance period (1 July 2013).
5 The number of Rights vested multiplied by the increase in the Qantas share price over the three year performance period ended 30 June 2016.
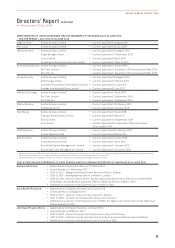
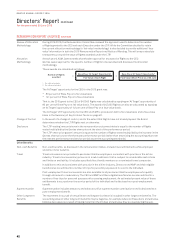
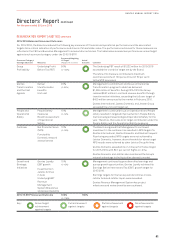
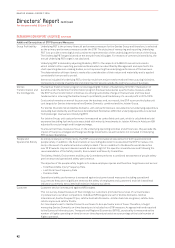
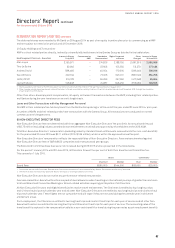
7) EXECUTIVE REMUNERATION STRUCTURE
Base Pay Base Pay is a guaranteed salary level, inclusive of superannuation. Each year, the Remuneration Committee
reviews the Base Pay for the CEO and Executive Management. An individual’s Base Pay, being a guaranteed
salary level, is not related to Qantas’ performance in a specific year.
Base Pay (cash), as disclosed in the remuneration tables, excludes superannuation (which is disclosed as
Post-employment Benefits) and includes salary sacrifice components such as motor vehicles.
In performing a Base Pay review, the Board makes reference to external market data including comparable
roles in other listed Australian companies and international airlines. The primary benchmark is a revenue-
based peer group of other listed Australian companies. The Board believes this is the appropriate
benchmark, as it is the comparator group whose roles best mirror the size, complexity and challenges in
managing Qantas’ businesses and is also the peer group with whom Qantas competes for Executive talent.
There have been no increases to the Base Pay for Mr Joyce (since July 2011), Mr Evans and Ms Hrdlicka (since
July 2012) and Mr David and Mr La Spina (since March 2015) during 2015/2016. In addition, the CEO forwent
five per cent of his Base Pay from 1 January 2014 until 30 June 2015. This ceased on 1 July 2015. Ms Grant
received a six per cent Base Pay increase from 1 July 2015.
The Base Pay for each Executive KMP is outlined on page 43.
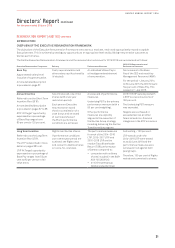
Annual Incentive
(STIP)
The STIP is the annual ‘at risk’ incentive plan for members of Qantas Executive Management. Each year
these Executives may receive an award that is a combination of cash and restricted shares to the extent that
the Plan’s performance conditions are achieved.
Performance
Conditions
The Board sets a ‘scorecard’ of performance conditions for the 2015/2016 STIP, aligning the performance
measures to the Qantas Group strategy. Underlying PBT is the key budgetary and financial performance
measure for the Qantas Group and is therefore the key performance measure in the STIP scorecard.
37
QANTAS ANNUAL REPORT 2016