Qantas 2016 Annual Report Download - page 63
Download and view the complete annual report
Please find page 63 of the 2016 Qantas annual report below. You can navigate through the pages in the report by either clicking on the pages listed below, or by using the keyword search tool below to find specific information within the annual report.-
 1
1 -
2
-
3
-
4
-
5
-
6
-
7
-
8
-
9
-
10
-
11
-
12
-
13
-
14
-
15
-
16
-
17
-
18
-
19
-
20
-
21
-
22
-
23
-
24
-
25
-
26
-
27
-
28
-
29
-
30
-
31
-
32
-
33
-
34
-
35
-
36
-
37
-
38
-
39
-
40
-
41
-
42
-
43
-
44
-
45
-
46
-
47
-
48
-
49
-
50
-
51
-
52
-
 53
53 -
 54
54 -
 55
55 -
 56
56 -
 57
57 -
 58
58 -
 59
59 -
 60
60 -
 61
61 -
 62
62 -
 63
63 -
 64
64 -
 65
65 -
 66
66 -
 67
67 -
 68
68 -
 69
69 -
 70
70 -
 71
71 -
 72
72 -
 73
73 -
74
-
75
-
76
-
77
-
78
-
79
-
80
-
81
-
82
-
83
-
84
-
85
-
86
-
87
-
88
-
89
-
90
-
91
-
92
-
93
-
94
-
95
-
96
-
97
-
98
-
99
-
100
-
101
-
102
-
103
-
104
-
105
-
106
 |
 |
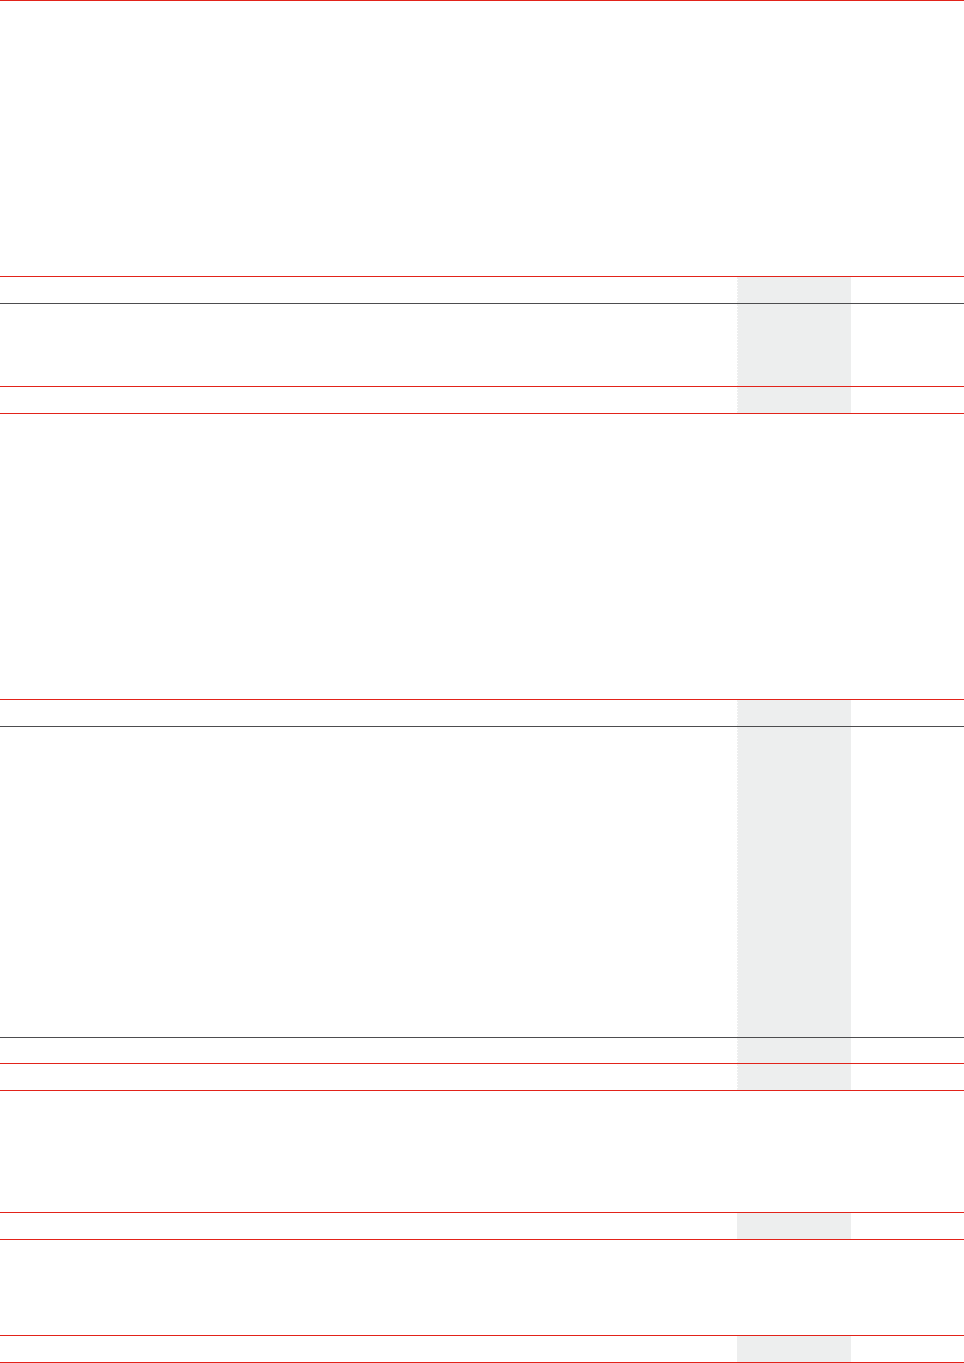
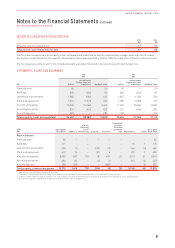
Notes to the Financial Statements continued
For the year ended 30 June 2016
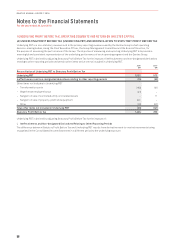
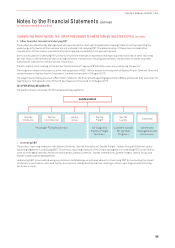
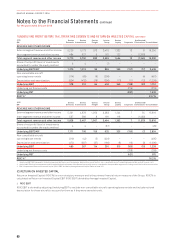
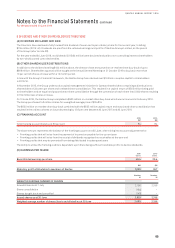
1 UNDERLYING PROFIT BEFORE TAX, OPERATING SEGMENTS AND RETURN ON INVESTED CAPITAL CONTINUED
The objective of this adjustment is to show an EBIT result which is indifferent to the financing or ownership structure of aircraft
assets. ROIC EBIT therefore excludes the finance costs implicitly included in operating lease rental payments.
2016
$M
2015
$M
ROIC EBIT
Underlying EBIT 1,751 1,233
Add: Non-cancellable aircraft lease rentals 461 495
Less: Notional depreciation1(203) (252)
ROIC EBIT 2,009 1,476
1 For calculating ROIC, capitalised operating leased aircraft are included in the Group’s Invested Capital at the AUD market value (referencing AVITAS) of the aircraft at the date of
commencing operations at the prevailing AUD/USD rate. This value is depreciated in accordance with the Group’s accounting policies with the calculated depreciation reported above
known as notional depreciation.
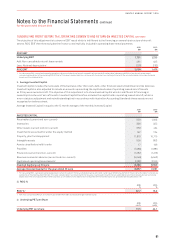
ii. Average Invested Capital
Invested Capital includes the net assets of the business other than cash, debt, other financial assets/(liabilities) and tax balances.
Invested Capital is also adjusted to include an amount representing the capitalised value of operating leased aircraft assets
as if they were owned aircraft. The objective of this adjustment is to show Invested Capital which is indifferent to financing or
ownership structures of aircraft assets. Invested Capital therefore includes the capital held in operating leased aircraft, which is
a non-statutory adjustment and notwithstanding that in accordance with Australian Accounting Standards these assets are not
recognised on balance sheet.
Average Invested Capital is equal to the 12 month average of the monthly Invested Capital.
2016
$M
2015
$M
INVESTED CAPITAL
Receivables (current and non-current) 929 1,093
Inventories 336 322
Other assets (current and non-current) 353 424
Investments accounted for under the equity method 197 134
Property, plant and equipment 11,670 10,715
Intangible assets 909 803
Assets classified as held for sale 17 136
Payables (1,986) (1,881)
Provisions (current and non-current) (1,287) (1,213)
Revenue received in advance (current and non-current) (5,046) (4,943)
Capitalised operating leased assets12,288 3,100
Invested Capital as at 30 June 8,380 8,690
Average Invested Capital for the year ended 30 June 8,857 9,091
1 For calculating ROIC, capitalised operating leased aircraft are included in the Group’s Invested Capital at the AUD market value (referencing AVITAS) of the aircraft at the date of commencing
operations at the prevailing AUD/USD rate. This value is depreciated in accordance with the Group’s accounting policies with the calculated depreciation reported above known as notional
depreciation. The carrying value (AUD market value less accumulated notional depreciation) is reported within Invested Capital as capitalised operating leased aircraft.
iii. ROIC %
2016
%
2015
%
ROIC %122.7 16.2
1 ROIC % is calculated as Return on Invested Capital EBIT (ROIC EBIT) divided by Average Invested Capital.
iv. Underlying PBT per Share
2016
cents
2015
cents
Underlying PBT per share 73.5 44.1
61
QANTAS ANNUAL REPORT 2016