Qantas 2016 Annual Report Download - page 43
Download and view the complete annual report
Please find page 43 of the 2016 Qantas annual report below. You can navigate through the pages in the report by either clicking on the pages listed below, or by using the keyword search tool below to find specific information within the annual report.-
 1
1 -
2
-
3
-
4
-
5
-
6
-
7
-
8
-
9
-
10
-
11
-
12
-
13
-
14
-
15
-
16
-
17
-
18
-
19
-
20
-
21
-
22
-
23
-
24
-
25
-
26
-
27
-
28
-
29
-
30
-
31
-
32
-
 33
33 -
 34
34 -
 35
35 -
 36
36 -
 37
37 -
 38
38 -
 39
39 -
 40
40 -
 41
41 -
 42
42 -
 43
43 -
 44
44 -
 45
45 -
 46
46 -
 47
47 -
 48
48 -
 49
49 -
 50
50 -
 51
51 -
 52
52 -
 53
53 -
54
-
55
-
56
-
57
-
58
-
59
-
60
-
61
-
62
-
63
-
64
-
65
-
66
-
67
-
68
-
69
-
70
-
71
-
72
-
73
-
74
-
75
-
76
-
77
-
78
-
79
-
80
-
81
-
82
-
83
-
84
-
85
-
86
-
87
-
88
-
89
-
90
-
91
-
92
-
93
-
94
-
95
-
96
-
97
-
98
-
99
-
100
-
101
-
102
-
103
-
104
-
105
-
106
 |
 |
Directors’ Report continued
For the year ended 30 June 2016
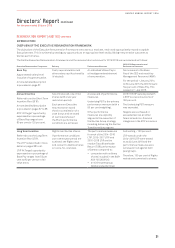
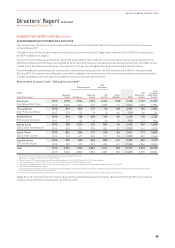
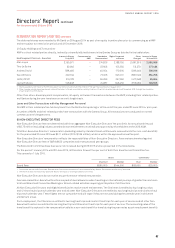
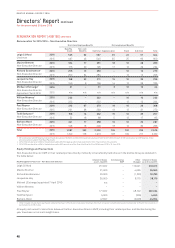
REMUNERATION REPORT (AUDITED) CONTINUED
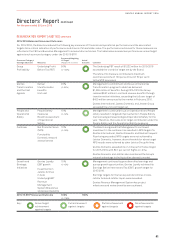
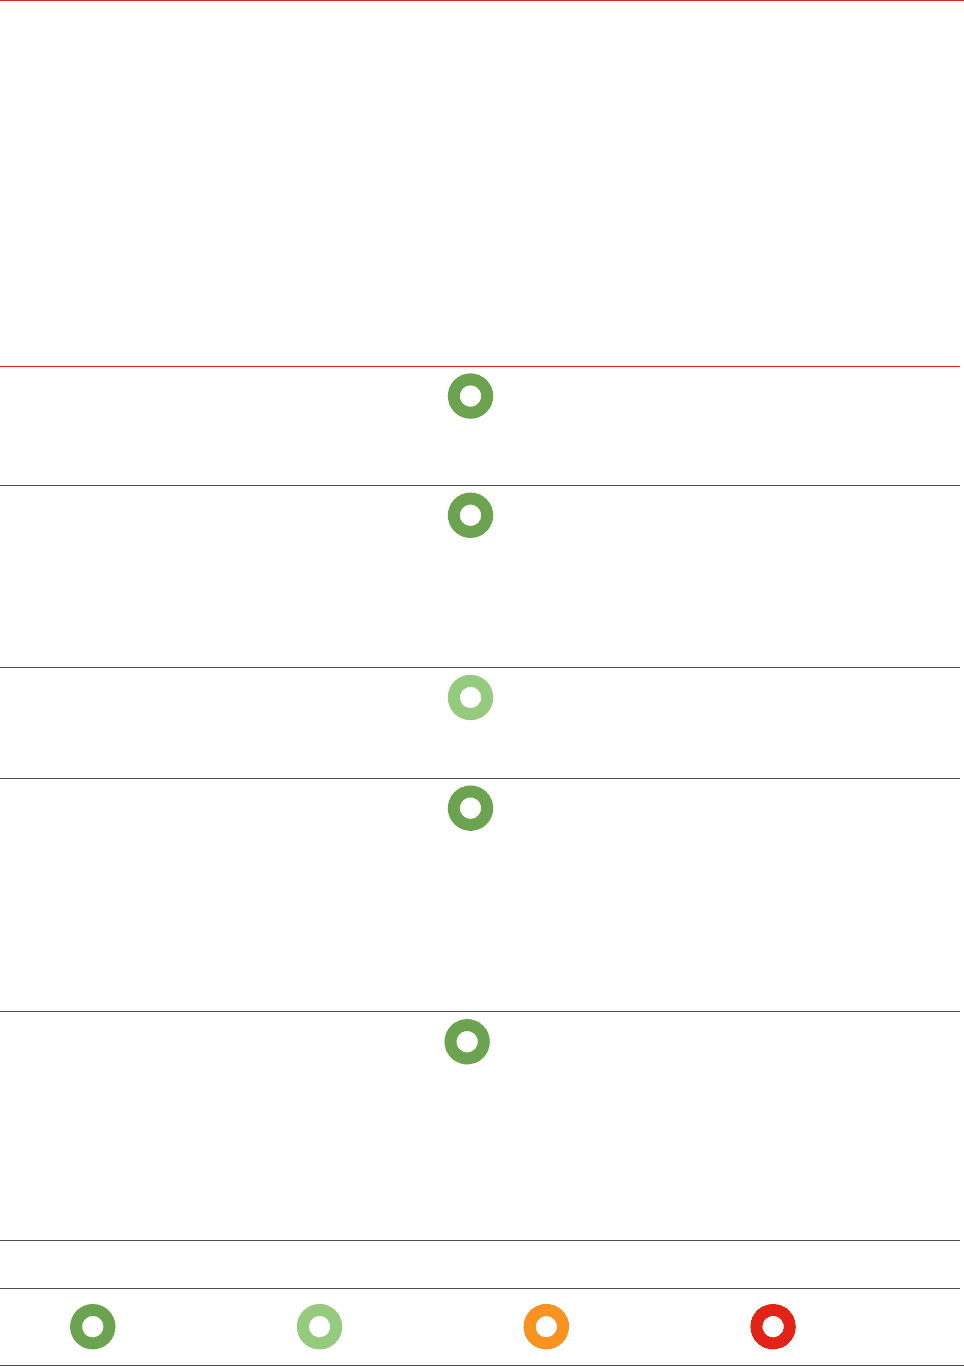
2015/2016 Balanced Scorecard Outcomes
For 2015/2016, the Board considered the following key measures of financial and operational performance and the associated
targets to be critical indicators of performance and drivers of shareholder value. The performance outcomes for these measures are
reflected in the CEO and Executive Management’s remuneration outcomes. The table below summarises performance versus target
against each scorecard category under the 2015/16 STIP.
Scorecard Category/
Strategic Objective Measures
Scorecard Weighting
‘At Target’
(Range of Outcomes)
Actual
Outcome Comment
Group
Profitability
Underlying Profit
Before Tax (PBT)
50%
(0–100%)
The Underlying PBT result of $1,532 million for 2015/2016
exceeded the ‘overdrive’ target set by the Board.
Therefore, this measure contributed a maximum
overdriveoutcome of 100 per cent (out of 50 per cent)
to the STIP scorecard.
Qantas
Transformation
and the Cost
Agenda
Deliver
transformation
benefits
Unit cost
20%
(0–30%)
Management’s commitment and focus on the Qantas
Transformation program to date has delivered
$1,655million of benefits. During 2015/2016 the Group
realised $557million in cost and revenue benefits through
transformation initiatives, exceeding the full year target of
$450 million announced to the market in February2016.
Qantas International, Qantas Domestic and Jetstar Group
exceeded the unit cost target set.
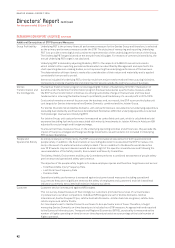
People and
Operational
Safety
People Safety
measures
Board’s assessment
of Operational
Safety
10%
(0–15%)
Management’s continued focus on Operational and People
safety resulted in targeted improvements in People Safety
metrics being achieved and good Operational Safety for the
year. Therefore, there was an at target contribution under the
People Safety and the Operational Safety measures.
Customer Net Promoter Score
(NPS)
Punctuality
Domestic network
attractiveness
10%
(0–15%)
The Board recognised that Management’s continued
investment in the customer has resulted in NPS targets for
Qantas International, Qantas Domestic and Qantas Frequent
Flyer being exceeded. NPS targets were not achieved by
Jetstar Domestic, however, above threshold or above target
NPS results were achieved by other Jetstar Group Airlines.
Qantas Domestic exceeded its on-time performance target
for 2015/2016, with 89.7 per cent of flights on-time.
Qantas Domestic and Jetstar also maintained the Group’s
network advantage in the Australian domestic market.
Growth and
Strategic
Initiatives
Qantas Loyalty:
EBIT growth
Investments in
Jetstar Airlines
inAsia:
Underlying EBIT
10%
(0–15%)
Management continued to grow diversified earnings and
pursue growth opportunities. Qantas Loyalty achieved its
Earnings Before Interest and Tax (EBIT) growth target for
2015/2016.
Earnings targets for the two key Jetstar Airlines in Asia,
Jetstar Asia and Jetstar Japan were exceeded.
Qantas Revenue Management System key project
milestones and review benefits were achieved.
Revenue
Management
System Milestones
and project benefits
2015/16 STIP Scorecard Outcome 100%
(0–175%)
160%
Key:
Above target
achievement
against targets
Full achievement
against targets
Partial achievement
against targets
No achievements
against targets
41
QANTAS ANNUAL REPORT 2016