Qantas 2016 Annual Report Download - page 37
Download and view the complete annual report
Please find page 37 of the 2016 Qantas annual report below. You can navigate through the pages in the report by either clicking on the pages listed below, or by using the keyword search tool below to find specific information within the annual report.-
 1
1 -
2
-
3
-
4
-
5
-
6
-
7
-
8
-
9
-
10
-
11
-
12
-
13
-
14
-
15
-
16
-
17
-
18
-
19
-
20
-
21
-
22
-
23
-
24
-
25
-
26
-
 27
27 -
 28
28 -
 29
29 -
 30
30 -
 31
31 -
 32
32 -
 33
33 -
 34
34 -
 35
35 -
 36
36 -
 37
37 -
 38
38 -
 39
39 -
 40
40 -
 41
41 -
 42
42 -
 43
43 -
 44
44 -
 45
45 -
 46
46 -
 47
47 -
48
-
49
-
50
-
51
-
52
-
53
-
54
-
55
-
56
-
57
-
58
-
59
-
60
-
61
-
62
-
63
-
64
-
65
-
66
-
67
-
68
-
69
-
70
-
71
-
72
-
73
-
74
-
75
-
76
-
77
-
78
-
79
-
80
-
81
-
82
-
83
-
84
-
85
-
86
-
87
-
88
-
89
-
90
-
91
-
92
-
93
-
94
-
95
-
96
-
97
-
98
-
99
-
100
-
101
-
102
-
103
-
104
-
105
-
106
 |
 |
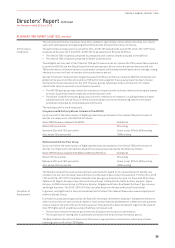
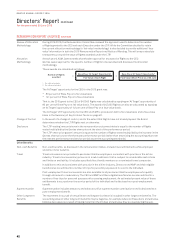
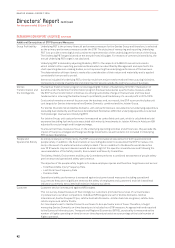
Directors’ Report continued
For the year ended 30 June 2016
REMUNERATION REPORT (AUDITED) CONTINUED
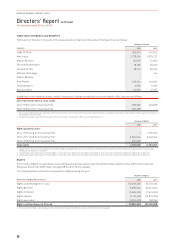
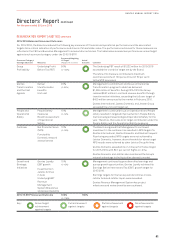
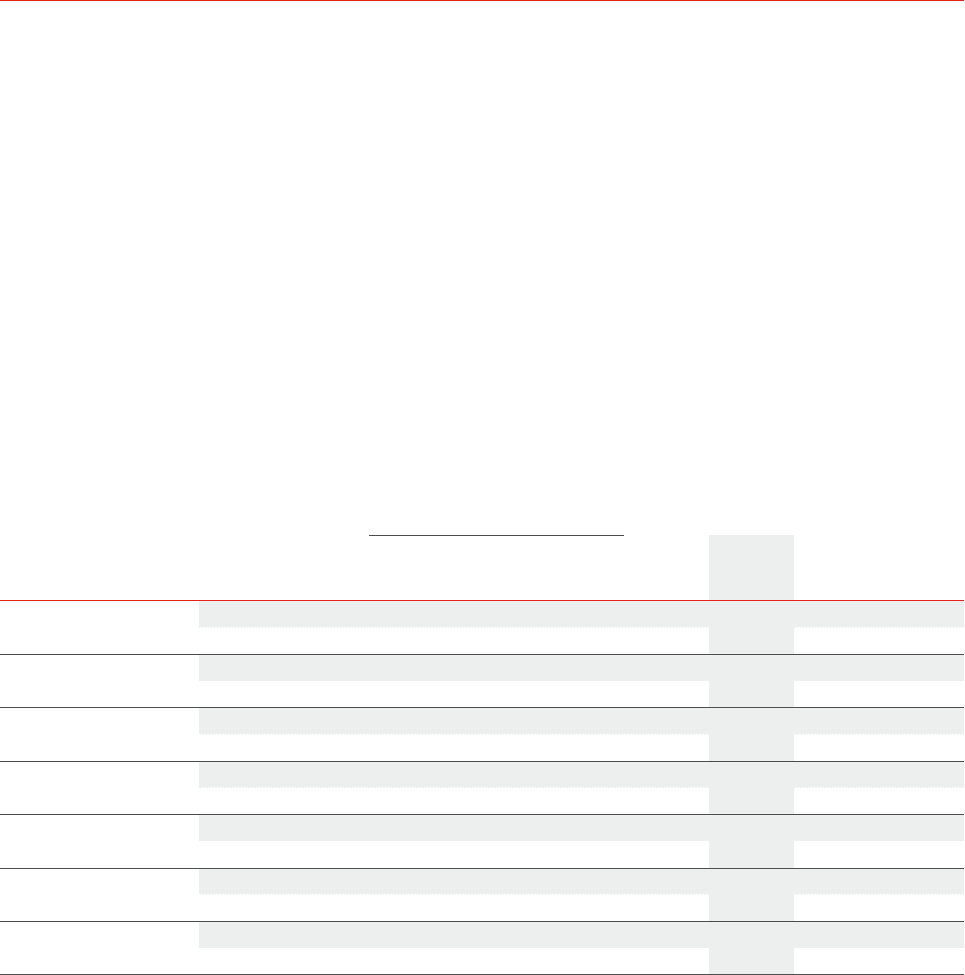
5) REMUNERATION OUTCOMES FOR 2015/2016
The remuneration decisions and outcomes at Qantas are clearly linked to Qantas’ performance via the performance measures
inthe STIP and LTIP.
This year’s record financial performance resulted in outcomes above the ‘At Target’ level under the 2015/16 STIP. The result under
theSTIP is detailed on page 41.
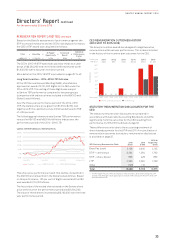
The performance measures for the 2014–2016 LTIP, being Qantas’ TSR relative to companies with ordinary shares included in the
ASX100 and Global Listed Airlines, were tested as at 30 June 2016. Based on the vesting scale, Qantas ranked 2nd in the ASX100 and
ranked 2nd in the Global Listed Airlines. This resulted in 100 per cent of Rights vesting and converting to Qantas shares.
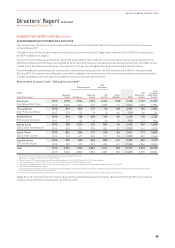
The following table summarises the remuneration decisions and outcomes for the CEO and Executive KMP for the year ended
30June2016. The remuneration detailed in this table is aligned to the current year performance and therefore is particularly useful
in understanding current year pay and its alignment with current year performance.
Remuneration Outcomes Table – CEO and Executive KMP1
STIP Outcomes3
LTIP
Outcomes4
$’000s
Current Executives
Base Pay
(Cash)2Cash Bonus
Deferred
Award
LTIP
Vesting5
Other
Benefits6Total
LTIP
Share Price
Growth7
Total
Including
Share Price
Growth
Alan Joyce
Chief Executive Officer
2016 2,10 6 3,264 1,632 2,904 (108) 9,798 3,162 12,960
2015 2,000 1,904 952 2,353 112 7, 321 4,563 11,88 4
Tino La Spina8
Chief Financial Officer
2016 831 834 417 92 108 2,282 100 2,382
2015 279 152 76 19 152 678 36 714
Andrew David8
CEO Qantas Domestic
2016 831 798 399 106 82 2,216 116 2,332
2015 277 152 76 29 72 606 57 663
Gareth Evans
CEO Qantas International
2016 981 1,024 512 855 66 3,438 930 4,368
2015 981 537 268 692 107 2,585 1,341 3,926
Lesley Grant
CEO Qantas Loyalty
2016 824 834 417 342 80 2,497 371 2,868
2015 781 411 205 277 58 1,732 537 2,269
Jayne Hrdlicka
CEO Jetstar Group
2016 981 939 469 855 141 3,385 930 4,315
2015 981 513 257 692 121 2,564 1,341 3,905
Total
2016 6,554 7,693 3,846 5,154 369 23,616 5,609 29,225
2015 5,299 3,669 1,834 4,062 622 15,486 7,875 23,361
1 Detail of non-statutory remuneration methodology is explained on pages 38 and 40.
2 Base Pay (cash) paid to each Executive during the year.
3 The full value of STIP awards made to each Executive during each of the 2015/2016 and 2014/2015 financial years.
4 LTIP awards vested in 2015/2016 at 100 per cent. LTIP awards vested in 2014/2015 at 85 per cent.
5 The number of Rights vested multiplied by the Qantas share price at 1 July 2013, as the start of the performance period (2015: 1 July 2012).
6 Other Benefits are detailed on page 40.
7 The ‘LTIP share price growth’ amount is equal to the number of Rights vested multiplied by the increase in the Qantas share price over the three year performance period ended
30June2016 (2015: 1 July 2012 to 30 June 2015).
8 2014/2015 remuneration reflects the period of time in a key management role for Mr La Spina and Mr David (1 March 2015 to 30 June 2015).
Pages 37 to 42 of the Remuneration Report describe Executive Remuneration Structure, Base Pay, STIP and LTIP and provide an
analysis of the 2015/2016 outcomes for the STIP and LTIP.
35
QANTAS ANNUAL REPORT 2016