Qantas 2016 Annual Report Download - page 21
Download and view the complete annual report
Please find page 21 of the 2016 Qantas annual report below. You can navigate through the pages in the report by either clicking on the pages listed below, or by using the keyword search tool below to find specific information within the annual report.-
 1
1 -
2
-
3
-
4
-
5
-
6
-
7
-
8
-
9
-
10
-
 11
11 -
 12
12 -
 13
13 -
 14
14 -
 15
15 -
 16
16 -
 17
17 -
 18
18 -
 19
19 -
 20
20 -
 21
21 -
 22
22 -
 23
23 -
 24
24 -
 25
25 -
 26
26 -
 27
27 -
 28
28 -
 29
29 -
 30
30 -
 31
31 -
32
-
33
-
34
-
35
-
36
-
37
-
38
-
39
-
40
-
41
-
42
-
43
-
44
-
45
-
46
-
47
-
48
-
49
-
50
-
51
-
52
-
53
-
54
-
55
-
56
-
57
-
58
-
59
-
60
-
61
-
62
-
63
-
64
-
65
-
66
-
67
-
68
-
69
-
70
-
71
-
72
-
73
-
74
-
75
-
76
-
77
-
78
-
79
-
80
-
81
-
82
-
83
-
84
-
85
-
86
-
87
-
88
-
89
-
90
-
91
-
92
-
93
-
94
-
95
-
96
-
97
-
98
-
99
-
100
-
101
-
102
-
103
-
104
-
105
-
106
 |
 |

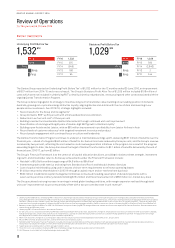
Review of Operations continued
For the year ended 30 June 2016
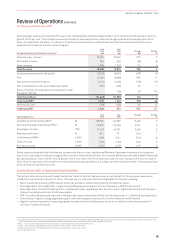
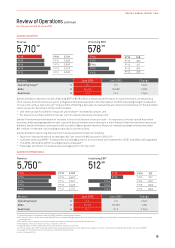
QANTAS DOMESTIC
Metrics June 2016 June 2015 Change
Operating margin37 %10.1 8.2 1.9pts
ASKs M36,260 36,638 (1.0)%
Seat factor %75.2 74.2 1.0pts
Qantas Domestic reported a record Underlying EBIT of $578 million, a stand out performance in a year that saw a continued drop
off in revenue from the resources sector and general demand weakness in the final quarter 2015/16. Operating margin increased to
10.1per cent, with ex-fuel unit cost38 improvement offsetting a decrease in revenue that was driven by the downturn in the Australian
resources sector. Key drivers of the result included:
–Unit revenue was flat while ex-resources unit revenue39 increased by one per cent
–Ex-fuel unit cost improvement of one per cent on capacity decrease of one per cent
Qantas Transformation delivered an increase in aircraft utilisation of two per cent40. In response to the two-speed Australian
economy, with passenger growth on east coast and leisure markets and contraction in intra-Western Australia and other resources
markets, Qantas Domestic continued to shift aircraft to higher-growth markets. Resource-related passenger revenue was down
$121million41 in the year, not including a reduction in charter activity.
Qantas Domestic saw strong improvement in all key operational metrics including:
–Record on-time performance increasing to 89.7 per cent from 88.3 per cent in 2014/1542
–Customer advocacy (NPS)43 increased five percentage points to a record result with investment in B737 and A330 cabin upgrades
–15 x A330–200 and 54 x B737 reconfigurations completed44
–Passenger seat factor increased one percentage point to 75.2 per cent
QANTAS INTERNATIONAL
Metrics June 2016 June 2015 Change
Operating margin %8.9 4.9 4.0pts
ASKs M63,599 59,263 7.3%
Seat factor %81.7 81.5 0.2pts
FY16
FY15
FY14
FY13
FY12
Underlying EBIT
512
$M
FY16 512
FY15 267
FY14 (497)
FY13 (246)
F Y12 (484)
FY16
FY15
FY14
FY13
FY12
Revenue
5,750
$M
FY16 5,750
FY15 5,467
FY14 5,297
FY13 5,496
F Y12 5,770
FY16
FY15
FY14
FY13
FY12
Underlying EBIT
578
$M
FY16 578
FY15 480
FY14 30
FY13 365
F Y12 463
FY16
FY15
FY14
FY13
FY12
Revenue
5,710
$M
FY16 5,710
FY15 5,828
FY14 5,848
FY13 6,218
F Y12 6,063
37 Operating margin calculated as Underlying EBIT divided by total segment revenue.
38 Ex-fuel unit cost is calculated as Underlying PBT less ticketed passenger revenue and fuel, adjusted for changes in: employee discount rates and other assumptions, and foreign
exchange rates.
39 Ex-resources unit revenue is unit revenue other than specific routes that are classified as resources.
40 Average block hours per aircraft per day compared to 2014/15.
41 Regular Public Transport (RPT) resources routes revenue compared to 2014/15.
42 On time performance (OTP) of Qantas Mainline (excluding QantasLink) operations. Measured as departures within 15 minutes of scheduled departure time. Source: BITRE.
43 Average 2015/16 net promotor score based on internal Qantas reporting.
44 As at 24 August 2016.
19
QANTAS ANNUAL REPORT 2016