Qantas 2016 Annual Report Download - page 17
Download and view the complete annual report
Please find page 17 of the 2016 Qantas annual report below. You can navigate through the pages in the report by either clicking on the pages listed below, or by using the keyword search tool below to find specific information within the annual report.-
 1
1 -
2
-
3
-
4
-
5
-
6
-
 7
7 -
 8
8 -
 9
9 -
 10
10 -
 11
11 -
 12
12 -
 13
13 -
 14
14 -
 15
15 -
 16
16 -
 17
17 -
 18
18 -
 19
19 -
 20
20 -
 21
21 -
 22
22 -
 23
23 -
 24
24 -
 25
25 -
 26
26 -
 27
27 -
28
-
29
-
30
-
31
-
32
-
33
-
34
-
35
-
36
-
37
-
38
-
39
-
40
-
41
-
42
-
43
-
44
-
45
-
46
-
47
-
48
-
49
-
50
-
51
-
52
-
53
-
54
-
55
-
56
-
57
-
58
-
59
-
60
-
61
-
62
-
63
-
64
-
65
-
66
-
67
-
68
-
69
-
70
-
71
-
72
-
73
-
74
-
75
-
76
-
77
-
78
-
79
-
80
-
81
-
82
-
83
-
84
-
85
-
86
-
87
-
88
-
89
-
90
-
91
-
92
-
93
-
94
-
95
-
96
-
97
-
98
-
99
-
100
-
101
-
102
-
103
-
104
-
105
-
106
 |
 |

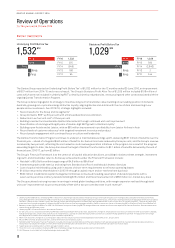
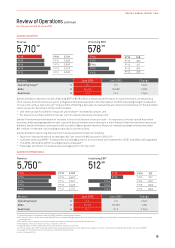
Review of Operations continued
For the year ended 30 June 2016
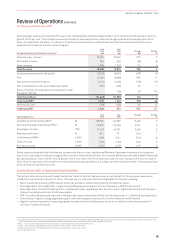
Net passenger revenue increased by three per cent, reflecting improved passenger loads in most markets and the Group’s capacity
growth of five per cent. This stronger revenue performance was supported by network changes and capacity management which
led to increased fleet utilisation. A reduction in the Group’s fuel expense resulted from lower AUD fuel prices and fuel efficiency
measures in the Qantas Transformation Program.
Group Underlying Income Statement Summary18
June
2016
$M
June
2015
$M
Change
$M
Change
%
Net passenger revenue 13,961 13,604 357 3
Net freight revenue 850 936 (86) (9)
Other revenue 1,389 1,276 113 9
Total Revenue 16,200 15,816 384 2
Operating expenses (excluding fuel) (9,529) (9,064) (465) (5)
Fuel (3,235) (3,899) 664 17
Depreciation and amortisation (1,224) (1,096) (128) (12)
Non-cancellable aircraft operating lease rentals (461) (495) 34 7
Share of net loss of investments accounted for under
the equity method –(29) 29 100
Total Expenditure (14,449) (14,583) 134 1
Underlying EBIT 1,751 1,233 518 42
Net finance costs (219) (258) 39 15
Underlying PBT 1,532 975 557 57
Operating Statistics
June
2016
June
2015
Change Change
%
Available Seat Kilometres (ASK)19 M148,691 142,287 6,404 5
Revenue Passenger Kilometres (RPK)20 M 119,054 112,543 6,511 6
Passengers carried ‘000 51,426 49,181 2,245 5
Revenue seat factor21 %80.1 79.1 1pts 1
Unit Revenue (RASK) c/ASK 8.08 8.21 (0.13) (2)
Total unit cost c/ASK (7.05) ( 7.5 4) 0.49 6
Ex-Fuel unit cost c/ASK (4.81) (4.97) 0.16 3
Group capacity (Available Seat Kilometres) increased by five per cent, and demand (Revenue Passenger Kilometres) increased by
sixper cent, resulting in a one percentage point increase in Revenue Seat Factor. Unit revenue (Revenue per Available Seat Kilometres)
decreased two per cent in 2015/16 with growth in the first-half of 2015/16 and a decrease in unit revenue in the second-half of
2015/16 as a proportion of the benefit from lower fuel prices was passed on in pricing in the international market. The Group’s ex-fuel
unit cost improved by three per cent.
CONTINUED DELIVERY OF BUSINESS TRANSFORMATION
The Group’s balanced scorecard through the Qantas Transformation Program ensures a net benefit for the customer experience
inaddition to permanent reduction of costs. This was seen in customer and brand highlights for the year including:
–Record customer advocacy (NPS) results at Qantas Domestic, Qantas International and Qantas Loyalty
–Reconfiguration of the A330 fleet, progressively adding ‘Business Suites’ with lie-flat beds on A330 family aircraft
–Reconfiguration of the B737 fleet with 5422 completed to date, upgrading cabin interiors and in-flight entertainment at the same
time as increasing seat count for efficiency gains
–B787 aircraft with enhanced customer offering in the Jetstar International fleet with the last three of 11 delivered during the year
–Continuation of global lounge upgrade program, with new lounges announced for London Heathrow and Brisbane
–Digital innovation focused on improving speed and ease of travel including auto check-in on mobile and the announced wi-fi
roll-out for Qantas Domestic
18 Underlying expenses differ from equivalent statutory expenses due to items excluded from Underlying PBT, such as adjustments for impacts of AASB 9 which relate to other reporting
periods and other items identified by Management. Refer to the reconciliation of statutory IBT to underlying PBT on page 22.
19 ASK – total number of seats available for passengers, multiplied by the number of kilometres flown.
20 RPK – total number of passengers carried, multiplied by the number of kilometres flown.
21 Revenue Seat Factor – RPK divided by ASK. Also known as seat factor, load factor or load.
22 As at 24 August 2016.
15
QANTAS ANNUAL REPORT 2016