Qantas 2016 Annual Report Download - page 20
Download and view the complete annual report
Please find page 20 of the 2016 Qantas annual report below. You can navigate through the pages in the report by either clicking on the pages listed below, or by using the keyword search tool below to find specific information within the annual report.-
 1
1 -
2
-
3
-
4
-
5
-
6
-
7
-
8
-
9
-
 10
10 -
 11
11 -
 12
12 -
 13
13 -
 14
14 -
 15
15 -
 16
16 -
 17
17 -
 18
18 -
 19
19 -
 20
20 -
 21
21 -
 22
22 -
 23
23 -
 24
24 -
 25
25 -
 26
26 -
 27
27 -
 28
28 -
 29
29 -
 30
30 -
31
-
32
-
33
-
34
-
35
-
36
-
37
-
38
-
39
-
40
-
41
-
42
-
43
-
44
-
45
-
46
-
47
-
48
-
49
-
50
-
51
-
52
-
53
-
54
-
55
-
56
-
57
-
58
-
59
-
60
-
61
-
62
-
63
-
64
-
65
-
66
-
67
-
68
-
69
-
70
-
71
-
72
-
73
-
74
-
75
-
76
-
77
-
78
-
79
-
80
-
81
-
82
-
83
-
84
-
85
-
86
-
87
-
88
-
89
-
90
-
91
-
92
-
93
-
94
-
95
-
96
-
97
-
98
-
99
-
100
-
101
-
102
-
103
-
104
-
105
-
106
 |
 |
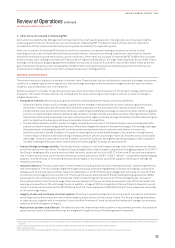
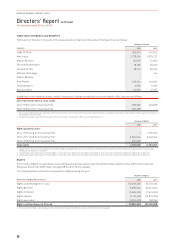
Review of Operations continued
For the year ended 30 June 2016
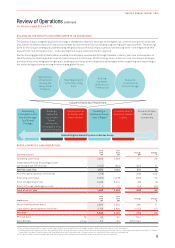
Operating cash flows of $2.8 billion saw a strong increase from the prior year, reflecting cost and revenue benefits realised through
the Qantas Transformation Program, and lower AUD fuel prices. When adjusted for the principal portion of operating rental
payments, Funds from Operations were $3.1 billion.
Net capital expenditure of $1 billion included investment in replacement fleet such as the Boeing 787 for Jetstar International and
customer experience initiatives including airport lounges and the continuation of Airbus A330 and Boeing 737 cabin reconfigurations.
Qantas generated $1.7 billion of net free cash flow in the period facilitating net debt reduction and returns to shareholders of
$1billion in the financial year.
With reduced financial leverage and minimal near-term refinancing risk, the Group has optimised the mix of liquidity with less
requirement for short-term liquidity held in cash. The Group used cash in excess of its short-term requirements to purchase aircraft
out of maturing operating leases, reducing the cash at period end and increasing the value of the Group’s pool of unencumbered
aircraft to over US$3.9 billion. Qantas continues to retain significant flexibility in its financial position, funding strategies and fleet
plan to ensure that it can respond to any change in market conditions.
At 30 June 2016, the Group’s leverage metrics were well within investment grade (BBB/Baa range) with FFO/net debt of 52 per cent
(2014/15: 45 per cent) and Debt/adjusted EBITDA of 2.5 times (2014/15: 3.0 times).
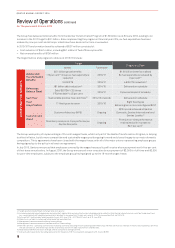
FLEET
The Qantas Group remains committed to a fleet strategy that provides for long-term flexibility and renewal. The fleet strategy
is designed to support the strategic objectives of the Group’s two flying brands and the overarching targets of the Qantas
Transformation Program. At all times, the Group retains significant flexibility to respond to any changes in market conditions
andthe competitive environment.
At 30 June 2016, the Qantas Group fleet35 totalled 303 aircraft. During 2015/16, the Group purchased six aircraft and reclassified one
aircraft from assets held for sale back into the fleet:
–Qantas – two B717–200s, one Bombardier Q300 and one Fokker 100
–Jetstar – three B787–8s
The Group removed three aircraft from service in 2015/16 including two lease returns. These included two A330–200s and one
B747–400. The Qantas Group’s scheduled passenger fleet average age is now 8.6 years36, within the targeted 8–10 year range.
Thebenefits of fleet investment include improved customer satisfaction, improved environmental outcomes, operational
efficiencies and cost reductions.
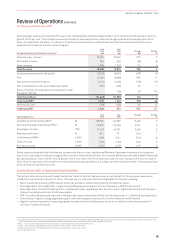
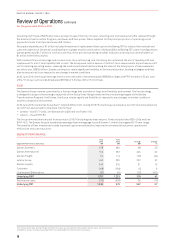
SEGMENT PERFORMANCE
Segment Performance Summary
June
2016
$M
June
2015
$M
Change
$M
Change
%
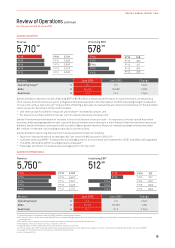
Qantas Domestic 578 480 98 20
Qantas International 512 267 245 92
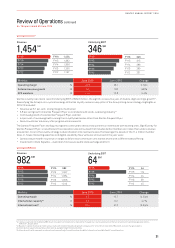
Qantas Freight 64 114 (50) (44)
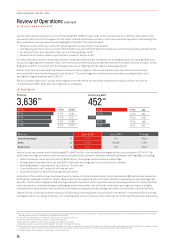
Jetstar Group 452 230 222 97
Qantas Loyalty 346 315 31 10
Corporate (168) (163) (5) 3
Unallocated/Eliminations (33) (10) (23) >100
Underlying EBIT 1,751 1,233 518 42
Net finance costs (219) (258) 39 (15)
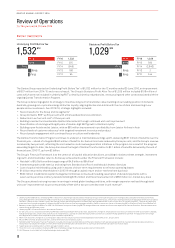
Underlying PBT 1,532 975 557 57
35 Includes Jetstar Asia, Qantas Freight and Network Aviation and excludes aircraft owned by Jetstar Japan and Jetstar Pacific.
36 Based on Group’s scheduled passenger fleet, excluding freighter aircraft and Network Aviation.
18
QANTAS ANNUAL REPORT 2016