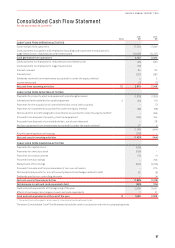
Qantas 2016 Annual Report Download - page 69
Download and view the complete annual report
Please find page 69 of the 2016 Qantas annual report below. You can navigate through the pages in the report by either clicking on the pages listed below, or by using the keyword search tool below to find specific information within the annual report.-
 1
1 -
2
-
3
-
4
-
5
-
6
-
7
-
8
-
9
-
10
-
11
-
12
-
13
-
14
-
15
-
16
-
17
-
18
-
19
-
20
-
21
-
22
-
23
-
24
-
25
-
26
-
27
-
28
-
29
-
30
-
31
-
32
-
33
-
34
-
35
-
36
-
37
-
38
-
39
-
40
-
41
-
42
-
43
-
44
-
45
-
46
-
47
-
48
-
49
-
50
-
51
-
52
-
53
-
54
-
55
-
56
-
57
-
58
-
 59
59 -
 60
60 -
 61
61 -
 62
62 -
 63
63 -
 64
64 -
 65
65 -
 66
66 -
 67
67 -
 68
68 -
 69
69 -
 70
70 -
 71
71 -
 72
72 -
 73
73 -
 74
74 -
 75
75 -
 76
76 -
 77
77 -
 78
78 -
 79
79 -
80
-
81
-
82
-
83
-
84
-
85
-
86
-
87
-
88
-
89
-
90
-
91
-
92
-
93
-
94
-
95
-
96
-
97
-
98
-
99
-
100
-
101
-
102
-
103
-
104
-
105
-
106
 |
 |

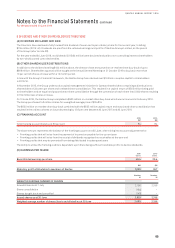
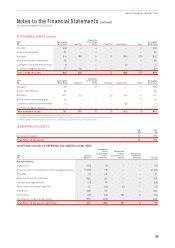
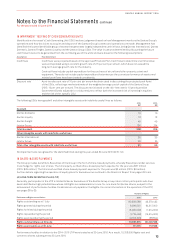
Notes to the Financial Statements continued
For the year ended 30 June 2016
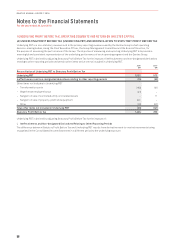
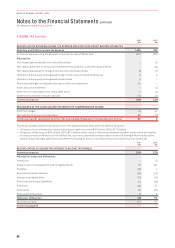
10 ASSETS CLASSIFIED AS HELD FOR SALE
2016
$M
2015
$M
Property, plant and equipment 17 136
Total assets classified as held for sale 17 136
The fair value measurement for property, plant and equipment classified as held for sale has been categorised under the fair value
hierarchy as Level 3 based on the inputs to the valuation technique used. Refer to Note 29(E) for a definition of the fair value hierarchy.
The fair value less costs to sell for the individual assets was determined with reference to recent sale transactions.
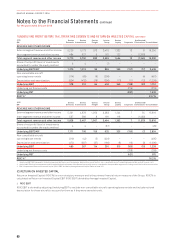
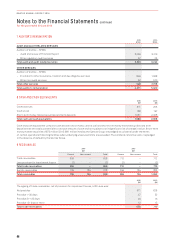
11 PROPERTY, PLANT AND EQUIPMENT
2016
$M
2015
$M
$M At Cost
Accumulated
Depreciation and
Impairment Net Book Value At Cost
Accumulated
Depreciation and
Impairment Net Book Value
Freehold land 50 –50 50 –50
Buildings 335 (220) 115 335 (214) 121
Leasehold improvements 1,385 (933) 452 1,647 (1,108) 539
Plant and equipment 1,504 (1,074) 430 1,535 (1,063) 472
Aircraft and engines 20,065 (10,146) 9,919 17, 937 (8,955) 8,982
Aircraft spare parts 837 (414) 423 791 (409) 382
Aircraft deposits 281 –281 169 –169
Total property, plant and equipment 24,457 (12,787) 11,670 22,464 (11,749) 10,715
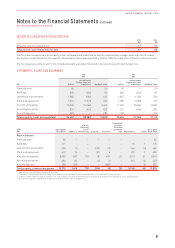
2016
$M
Opening Net
Book Value Additions1
Aircraft
Operating
Lease
Refinancing Disposals Transfers2
Transferred
to Assets
Classified
as Held for
Sale Depreciation Other3
Closing Net
Book Value
Reconciliations
Freehold land 50 – – – – – – – 50
Buildings 121 – – – – – (7) 1115
Leasehold improvements 539 75 –(104) (10) –(44) (4) 452
Plant and equipment 472 74 –(51) 4 – (76) 7 430
Aircraft and engines48,982 587 778 (8) 481 20 (972) 51 9,919
Aircraft spare parts 382 84 –(1) (1) –(37) (4) 423
Aircraft deposits 169 594 – – (480) – – (2) 281
Total property, plant and equipment 10,715 1,414 778 (164) (6) 20 (1,136) 49 11,670
1 Additions include capitalised interest of $19 million.
2 Transfers include transfers between categories of property, plant and equipment and transfers from/(to) other balance sheet accounts.
3 Other includes foreign exchange movements, non-cash additions including those relating to finance leases and impairments of property, plant and equipment.
4 Aircraft and engines include finance-leased assets with a net book value of $1,507 million.
67
QANTAS ANNUAL REPORT 2016