Qantas 2016 Annual Report Download - page 15
Download and view the complete annual report
Please find page 15 of the 2016 Qantas annual report below. You can navigate through the pages in the report by either clicking on the pages listed below, or by using the keyword search tool below to find specific information within the annual report.-
 1
1 -
2
-
3
-
4
-
 5
5 -
 6
6 -
 7
7 -
 8
8 -
 9
9 -
 10
10 -
 11
11 -
 12
12 -
 13
13 -
 14
14 -
 15
15 -
 16
16 -
 17
17 -
 18
18 -
 19
19 -
 20
20 -
 21
21 -
 22
22 -
 23
23 -
 24
24 -
 25
25 -
26
-
27
-
28
-
29
-
30
-
31
-
32
-
33
-
34
-
35
-
36
-
37
-
38
-
39
-
40
-
41
-
42
-
43
-
44
-
45
-
46
-
47
-
48
-
49
-
50
-
51
-
52
-
53
-
54
-
55
-
56
-
57
-
58
-
59
-
60
-
61
-
62
-
63
-
64
-
65
-
66
-
67
-
68
-
69
-
70
-
71
-
72
-
73
-
74
-
75
-
76
-
77
-
78
-
79
-
80
-
81
-
82
-
83
-
84
-
85
-
86
-
87
-
88
-
89
-
90
-
91
-
92
-
93
-
94
-
95
-
96
-
97
-
98
-
99
-
100
-
101
-
102
-
103
-
104
-
105
-
106
 |
 |

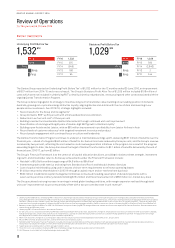
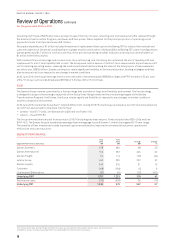
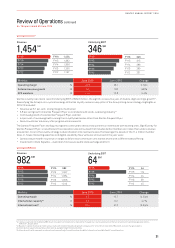
Domestic Australia experienced a stable operating environment in non-resources sectors:
–Lower AUD and increased inbound visitor arrivals supporting domestic traffic growth
–Resource related traffic and revenue down compared to 2014/15
–Fourth quarter 2015/16 general demand weakness
The Group’s international operating environment was more competitive, with competitor capacity growth and sharper pricing activity
seen on key routes:
–Increased industry capacity growth on the back of higher operating margins
–Industry-wide pricing activity passing on a portion of fuel benefit
–Geopolitical uncertainty impacting northern hemisphere travel
–Qantas and Jetstar capacity growth focused on higher demand markets in Asia
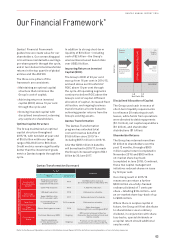
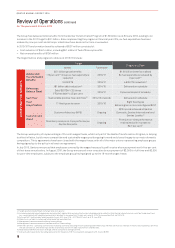
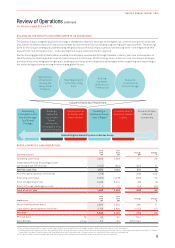
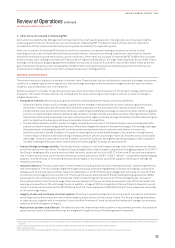
FINANCIAL FRAMEWORK ALIGNED WITH SHAREHOLDER OBJECTIVES
Qantas’ Financial Framework aligns our objectives with those of our shareholders. With the aim of generating maintainable Earnings
per share growth over the cycle, which in turn should translate into Total Shareholder Returns (TSR) in the top quartile of the ASX100
and a basket of global airlines11, the Financial Framework has three clear priorities and associated long-term targets:
MAINTAINABLE EPS13 GROWTH OVER THE CYCLE
TOTAL SHAREHOLDER RETURNS IN THE TOP QUARTILE
1. Maintaining an Optimal Capital
Structure
2. ROIC > WACC12 Through the Cycle 3. Disciplined Allocation of Capital
Minimise cost of capital by targeting a
net debt range of $4.8 billion to $6billion
Deliver ROIC > 10 per cent through
the cycle
Grow Invested Capital with disciplined
investment, return surplus capital
Maintaining an Optimal Capital Structure
Surplus Capital No Surplus Capital
OPTIMAL CAPITAL
STRUCTURE
Debt reduction
focus
Increased
distributions, grow
invested capital
10% ROIC
Net Debt ($B)
$4.8 $6.0
ROIC (%)
–The Group’s Financial Framework targets an optimal
capital structure with a net debt range of between
$4.8billion and $6 billion, based on the current Average
Invested Capital of approximately $9 billion. This capital
structure lowers the Group’s cost of capital, preserves
financial strength, and therefore enhances long-term
shareholder value.
–Capital allocation decisions, including distributions to
shareholders, are sized to remain within the target net debt
range on a forward basis.
–The Group’s optimal capital structure is consistent with
investment grade credit metrics from Standard and Poor’s
and Moody’s Investor Services.
11 Target Total Shareholder Returns within the top quartile of the ASX100 and global listed airline peer group as stated in the 2015 Annual Report, with reference to the 2015-2017 Long Term
Incentive Plan (LTIP).
12 Weighted Average Cost of Capital (WACC) is calculated on a pre-tax basis.
13 Earnings per share.
Review of Operations continued
For the year ended 30 June 2016
13
QANTAS ANNUAL REPORT 2016