Qantas 2016 Annual Report Download - page 18
Download and view the complete annual report
Please find page 18 of the 2016 Qantas annual report below. You can navigate through the pages in the report by either clicking on the pages listed below, or by using the keyword search tool below to find specific information within the annual report.-
 1
1 -
2
-
3
-
4
-
5
-
6
-
7
-
 8
8 -
 9
9 -
 10
10 -
 11
11 -
 12
12 -
 13
13 -
 14
14 -
 15
15 -
 16
16 -
 17
17 -
 18
18 -
 19
19 -
 20
20 -
 21
21 -
 22
22 -
 23
23 -
 24
24 -
 25
25 -
 26
26 -
 27
27 -
 28
28 -
29
-
30
-
31
-
32
-
33
-
34
-
35
-
36
-
37
-
38
-
39
-
40
-
41
-
42
-
43
-
44
-
45
-
46
-
47
-
48
-
49
-
50
-
51
-
52
-
53
-
54
-
55
-
56
-
57
-
58
-
59
-
60
-
61
-
62
-
63
-
64
-
65
-
66
-
67
-
68
-
69
-
70
-
71
-
72
-
73
-
74
-
75
-
76
-
77
-
78
-
79
-
80
-
81
-
82
-
83
-
84
-
85
-
86
-
87
-
88
-
89
-
90
-
91
-
92
-
93
-
94
-
95
-
96
-
97
-
98
-
99
-
100
-
101
-
102
-
103
-
104
-
105
-
106
 |
 |
Review of Operations continued
For the year ended 30 June 2016
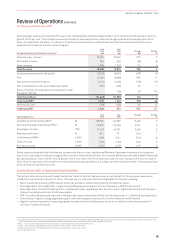
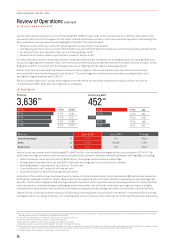
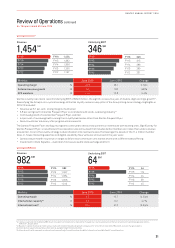
The Group has delivered total benefits from the Qantas Transformation Program of $1.66 billion as at 30 June 2016, leading to an
increase in the 2017 target to $2.1 billion. Since implementing the program in financial year 2014, ex-fuel expenditure has been
reduced by nine per cent and all major milestones have been met on time or exceeded.
In 2015/16 Transformation benefits achieved of $557 million consisted of:
–Cost reduction of $451 million, including $51 million of fuel efficiency benefits
–Net revenue benefits of $106 million
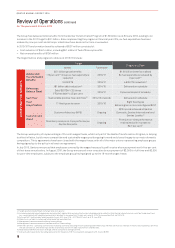
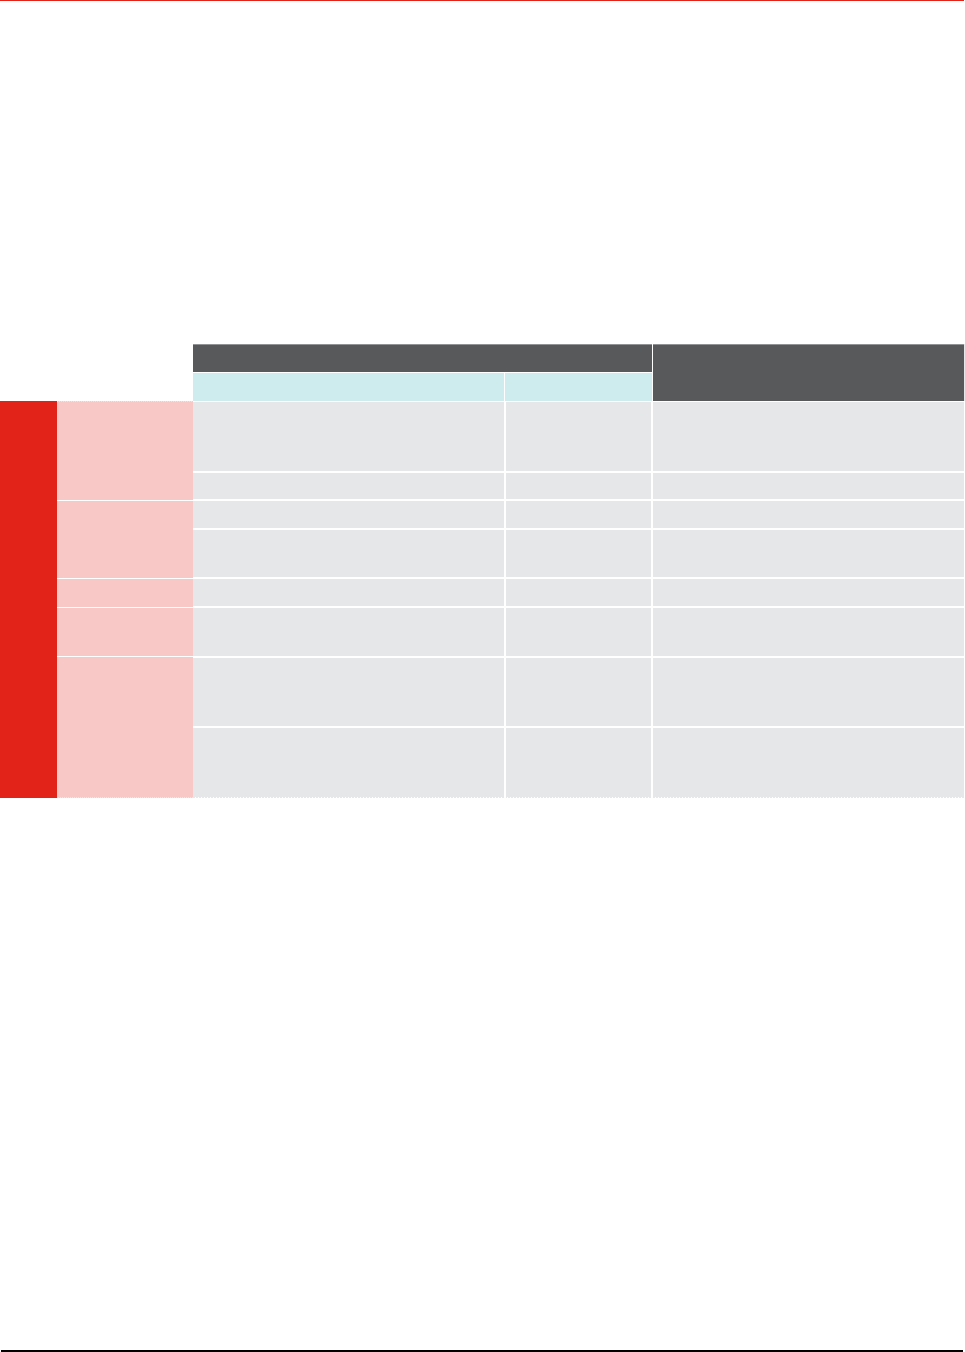
The target metrics and progress to date as at 2015/16 include:
Target Progress to Date
Metric Timeframe
ACHIEVING OUR TARGETS
Accelerated
Transformation
Benefits
$2.1 billion gross benefits
>10 per cent23 Group ex-fuel expenditure
reduction
2016/17
$1.66 billion benefits realised
Ex-fuel expenditure reduced by
9 per cent24
5,000 FTE 2016/17 4,605 FTE reduction25
Deleverage
Balance Sheet
>$1 billion debt reduction26 2014/15 Delivered on schedule
Debt/EBITDA27<3.5 times
FFO/net debt28> 45 per cent 2016/17 Delivered ahead of schedule
Cash Flow Sustainable positive free cash flow29 2014/15 onwards Delivered on schedule
Fleet
Simplification 11 fleet types to seven 2015/16 Eight fleet types
Retaining two x non-reconfigured B747
Customer and
Brand
Customer Advocacy (NPS) Ongoing
NPS record achieved at Qantas
Domestic, Qantas International and
Qantas Loyalty30
Maintain premium on-time performance
Qantas Domestic Ongoing
Premium on-time performance
maintained with increase to
89.7percent31
The Group-wide policy of implementing an 18-month wages freeze, whilst not part of the Qantas Transformation Program, is helping
to offset inflation, build a more competitive and sustainable wages position going forward and closes the gap to our major domestic
competitors. Thirty agreements have been closed with the wages freeze, with all of the major unions representing employee groups
having signed up to the policy in at least one agreement.
In July 2015, Qantas announced that employees covered by the wages freeze policy will receive a bonus payment worth five per cent
of their base annual salary. In August 2016, the Group announced a non-executive bonus payment of $3,000 for full-time and $2,500
for part-time employees, subject to the employee group having signed up to the 18-month wages freeze.
23 Target assumes steady foreign exchange rates and capacity.
24 Includes underlying operating expenses (excluding fuel), depreciation and amortisation (excluding depreciation reduction from Qantas International non-cash fleet impairment) and
non-cancellable aircraft operating lease rentals, adjusted for movements in FX rates and capacity. 2015/16 vs annualised first-half 2014/15.
25 Actioned Full Time Equivalent employee reduction as at 30 June 2016. ~30 FTEs still to exit as at 30 June 2016.
26 Reduction in net debt including capitalised operating lease liabilities.
27 Management’s estimate based on Moody’s methodology.
28 Management’s estimate based on Standard and Poor’s methodology.
29 Net free cash flow – operating cash flows less investing cash flows (excluding Aircraft operating lease refinancing). Net free cash flow is a measure of the amount of operating cash flows
that are available (i.e. after investing activities) to fund reductions in net debt or payments to shareholders.
30 Measured as Net Promoter Score. Average 2015/16 compared to average 2014/15.
31 Qantas mainline operations (excluding QantasLink) for the period 2015/16 compared to average 2014/15. Source: BITRE.
16
QANTAS ANNUAL REPORT 2016