Qantas 2016 Annual Report Download - page 16
Download and view the complete annual report
Please find page 16 of the 2016 Qantas annual report below. You can navigate through the pages in the report by either clicking on the pages listed below, or by using the keyword search tool below to find specific information within the annual report.-
 1
1 -
2
-
3
-
4
-
5
-
 6
6 -
 7
7 -
 8
8 -
 9
9 -
 10
10 -
 11
11 -
 12
12 -
 13
13 -
 14
14 -
 15
15 -
 16
16 -
 17
17 -
 18
18 -
 19
19 -
 20
20 -
 21
21 -
 22
22 -
 23
23 -
 24
24 -
 25
25 -
 26
26 -
27
-
28
-
29
-
30
-
31
-
32
-
33
-
34
-
35
-
36
-
37
-
38
-
39
-
40
-
41
-
42
-
43
-
44
-
45
-
46
-
47
-
48
-
49
-
50
-
51
-
52
-
53
-
54
-
55
-
56
-
57
-
58
-
59
-
60
-
61
-
62
-
63
-
64
-
65
-
66
-
67
-
68
-
69
-
70
-
71
-
72
-
73
-
74
-
75
-
76
-
77
-
78
-
79
-
80
-
81
-
82
-
83
-
84
-
85
-
86
-
87
-
88
-
89
-
90
-
91
-
92
-
93
-
94
-
95
-
96
-
97
-
98
-
99
-
100
-
101
-
102
-
103
-
104
-
105
-
106
 |
 |
Review of Operations continued
For the year ended 30 June 2016
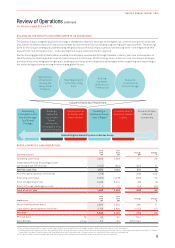
ROIC > WACC Through the Cycle
Return on Invested Capital (ROIC) of 22.7 per cent, up
from 16.2per cent in the prior year, was achieved
through
generating higher returns from existing assets. Average
Invested Capital in 2015/16 of $8.9billion was slightly
below Average Invested Capital of $9.1 billion in 2014/15
with disciplined
capital expenditure. With increased
fleet utilisation, cost reduction through the Qantas
Transformation Program and lower fuel prices, returns were
well above the Group’s threshold target of ROIC greater than
10percent.
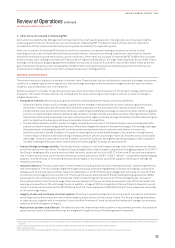
Disciplined Allocation of Capital
Funds from
Operations
$3.1b
Debt reduction
$1.1b
Net capex
$1.0b
Shareholder
distributions
$1.0b
Reduction in cash
balance
$0.9b
Refinancing of
operating leases
$0.8b
Sources Uses
Funds from Operations (FFO)14 increased to $3.1billion in
2015/16. FFO were applied to:
–$1.1 billion of debt repayments15
–$1 billion of net capital expenditure16 in line withguidance
–$1 billion distributed to shareholders in 2015/16 through
a share buy-back and capitalreturn
$778 million cash in excess of short-term liquidity
requirements was used to refinance 29 aircraft out of
maturing operating leases. Using the Group’s existing cash
balance in this way achieved the following benefits:
–Reduced gross debt and cost of carry, minimal impact to
net debt
–Greater fleet and maintenance planning flexibility
–Reduced exposure to USD lease rentals
–Increased value of unencumbered assets to over
US$3.9billion17
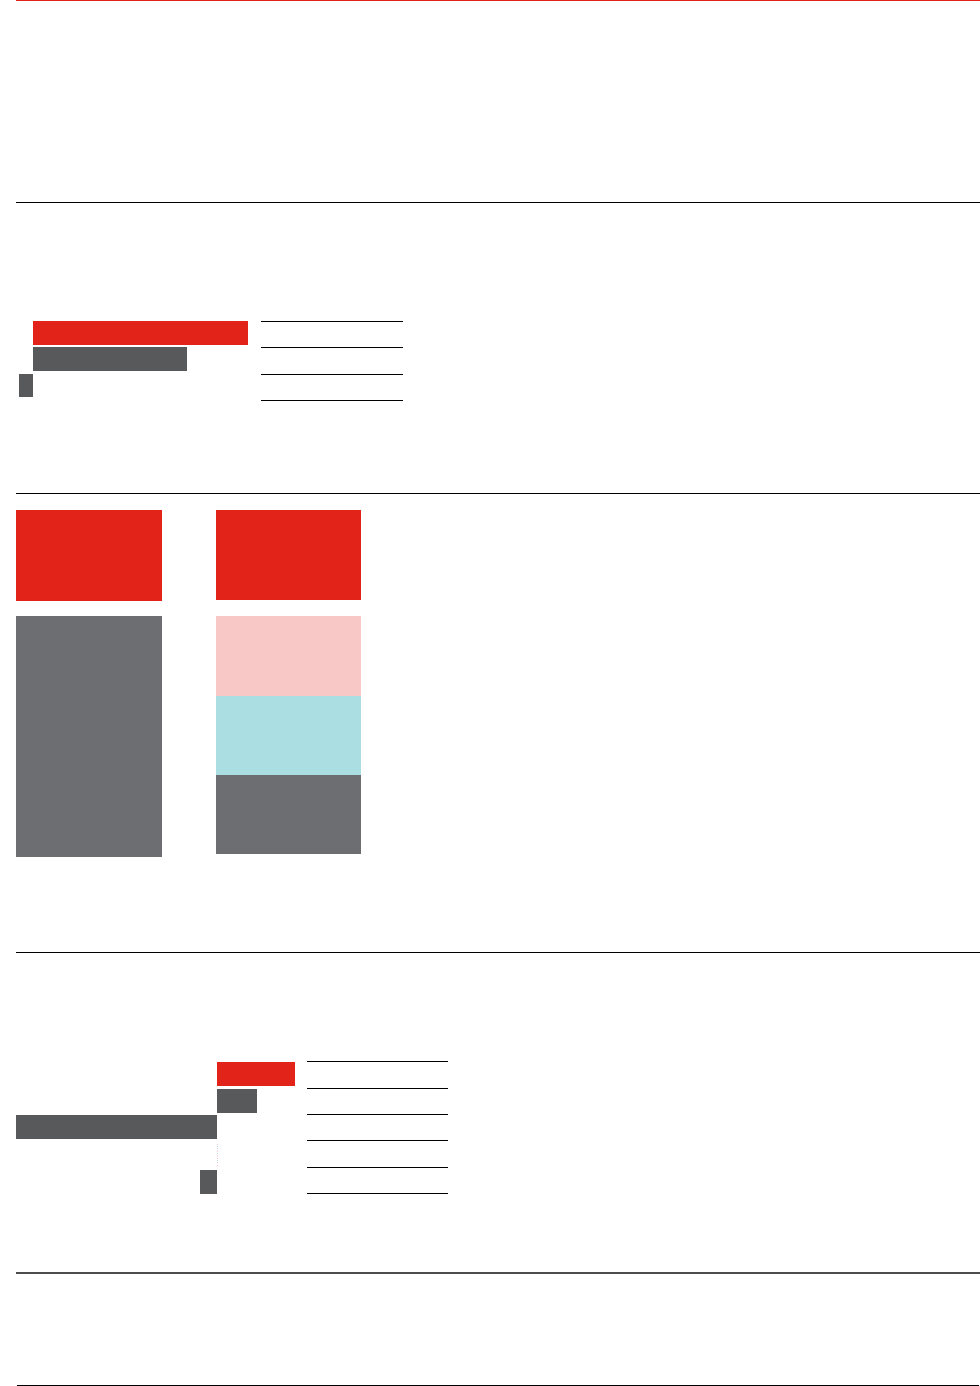
Maintainable EPS Growth over the Cycle
Earnings per share almost doubled to 49.4 cents, with an
84percent improvement in Statutory Profit After Tax and a
12.6per cent reduction in shares on issue.
Shares on issue
were reduced through the $505 million
capital return and
related share consolidation as well as the $500million on-
market share buy-back, both ofwhich were completed in
2015/16.
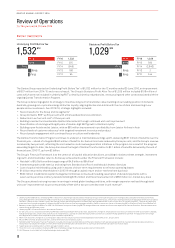
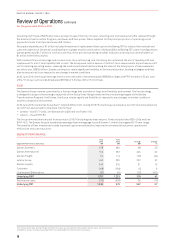
UNDERLYING PBT
The Qantas Group’s full-year 2015/16 Underlying PBT increased to $1,532 million, compared to an Underlying PBT of $975 million
in 2014/15. The significant improvement in earnings was driven by the delivery of a reduction in ex-fuel unit cost, fuel efficiency
initiatives, and revenue benefits from the Qantas Transformation Program and the benefits of lower fuel prices captured by the
Group’s disciplined hedging program.
FY16
FY15
FY14
Return on Invested Capital
23
%
FY16 22.7%
FY15 16.2%
FY14 (1.5%)
FY16
FY15
FY14
FY13
FY12
Earnings Per Share
49.4
cents
FY16 49.4
FY15 25.4
FY14 (128.5)
FY13 0.0
F Y12 (10.8)
14 Funds from Operations of $3.1 billion is equal to operating cash flows in the Consolidated Cash Flow Statement adjusted for the principal portion of operating leased aircraft rental
payments. The principal portion of aircraft operating lease rentals are considered a debt repayment in the Group’s financial framework. After this adjustment, the interest portion of
lease rental payments continues to be recognised as an outflow in Funds from Operations.
15 Debt repayments of $1.1 billion refers to repayment of on balance sheet borrowings and capitalised operating lease liability repayments (excluding cash flows relating to aircraft
operating lease refinancing). Debt reduction is equal to the total of financing cash flows in the statement of cash flows excluding shareholder distributions and payments for treasury
shares, principal portion of operating leased aircraft rental payments and reduction of capitalised operating leases from the return of leased aircraft.
16 Net capital expenditure of $1 billion is equal to net investing cash flows included in the Consolidated Cash Flow Statement (excluding aircraft operating lease refinancing) less the
impact to invested capital of returning operating lease aircraft.
17 Based on AVAC market values.
14
QANTAS ANNUAL REPORT 2016