Qantas 2016 Annual Report Download - page 46
Download and view the complete annual report
Please find page 46 of the 2016 Qantas annual report below. You can navigate through the pages in the report by either clicking on the pages listed below, or by using the keyword search tool below to find specific information within the annual report.-
 1
1 -
2
-
3
-
4
-
5
-
6
-
7
-
8
-
9
-
10
-
11
-
12
-
13
-
14
-
15
-
16
-
17
-
18
-
19
-
20
-
21
-
22
-
23
-
24
-
25
-
26
-
27
-
28
-
29
-
30
-
31
-
32
-
33
-
34
-
35
-
 36
36 -
 37
37 -
 38
38 -
 39
39 -
 40
40 -
 41
41 -
 42
42 -
 43
43 -
 44
44 -
 45
45 -
 46
46 -
 47
47 -
 48
48 -
 49
49 -
 50
50 -
 51
51 -
 52
52 -
 53
53 -
 54
54 -
 55
55 -
 56
56 -
57
-
58
-
59
-
60
-
61
-
62
-
63
-
64
-
65
-
66
-
67
-
68
-
69
-
70
-
71
-
72
-
73
-
74
-
75
-
76
-
77
-
78
-
79
-
80
-
81
-
82
-
83
-
84
-
85
-
86
-
87
-
88
-
89
-
90
-
91
-
92
-
93
-
94
-
95
-
96
-
97
-
98
-
99
-
100
-
101
-
102
-
103
-
104
-
105
-
106
 |
 |
Directors’ Report continued
For the year ended 30 June 2016
REMUNERATION REPORT (AUDITED) CONTINUED
–Required to comply with ‘request to deal’ procedures prior to dealing in Qantas securities (or the securities of any Qantas Group
listed entity) outside of defined closed periods
–Prohibited from hedging or entering into any margin lending arrangement, or entering into any other encumbrances over the
securities of Qantas (or the securities of any Qantas Group listed entity) at any time
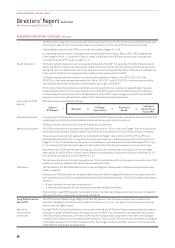
Remuneration Mix
The Base Pay and ‘At Target’ STIP and LTIP opportunities are set with reference to external benchmark market data including
comparable roles in other listed Australian companies and international airlines. The ‘At Target’ STIP and LTIP opportunities for the
CEO and KMP are detailed in the Summary of Key Contract Terms on page 43.
For 2014/2015 only, the Board changed the remuneration mix for the CEO and Executive Management to further align incentives with
the immediate priorities of the transformation agenda.
This change in pay mix for that year involved a decrease in the STIP opportunity and an increase in the LTIP opportunity for each
Executive. There was no increase to the total ‘At Target’ remuneration as a result of these changes as the increase in LTIP opportunity
was offset by a decrease in STIP opportunity. The three year performance period of the 2015–2017 LTIP aligns with the timeframe for
achieving the $2.1 billion program benefits due for completion by the end of 2016/2017. For 2015/2016 the remuneration mix for the
CEO and Executive Management reverted to the original pay mix for the relevant role.
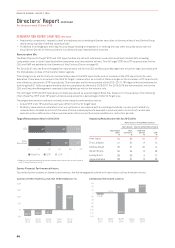
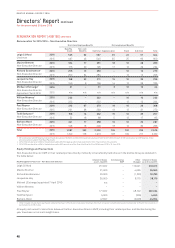
The ‘At Target’ STIP and LTIP awards are normally expressed as a percentage of Base Pay, however, for the purpose of the following
chart, Base Pay, STIP and LTIP opportunities are expressed as a percentage of total ‘At Target’ pay.
The target remuneration mix does not match the statutory remuneration mix as:
–Actual STIP and LTIP outcomes each year differ from the ‘At Target’ level
–Statutory reward mix is calculated on an accrual basis in accordance with accounting standards, so each year’s statutory
remuneration includes a portion of the value of share-based payments awarded in previous years. A portion of current year
awards are also deferred over future periods where there are performance conditions or restriction periods
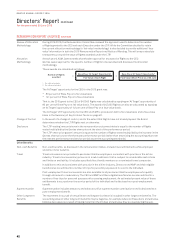
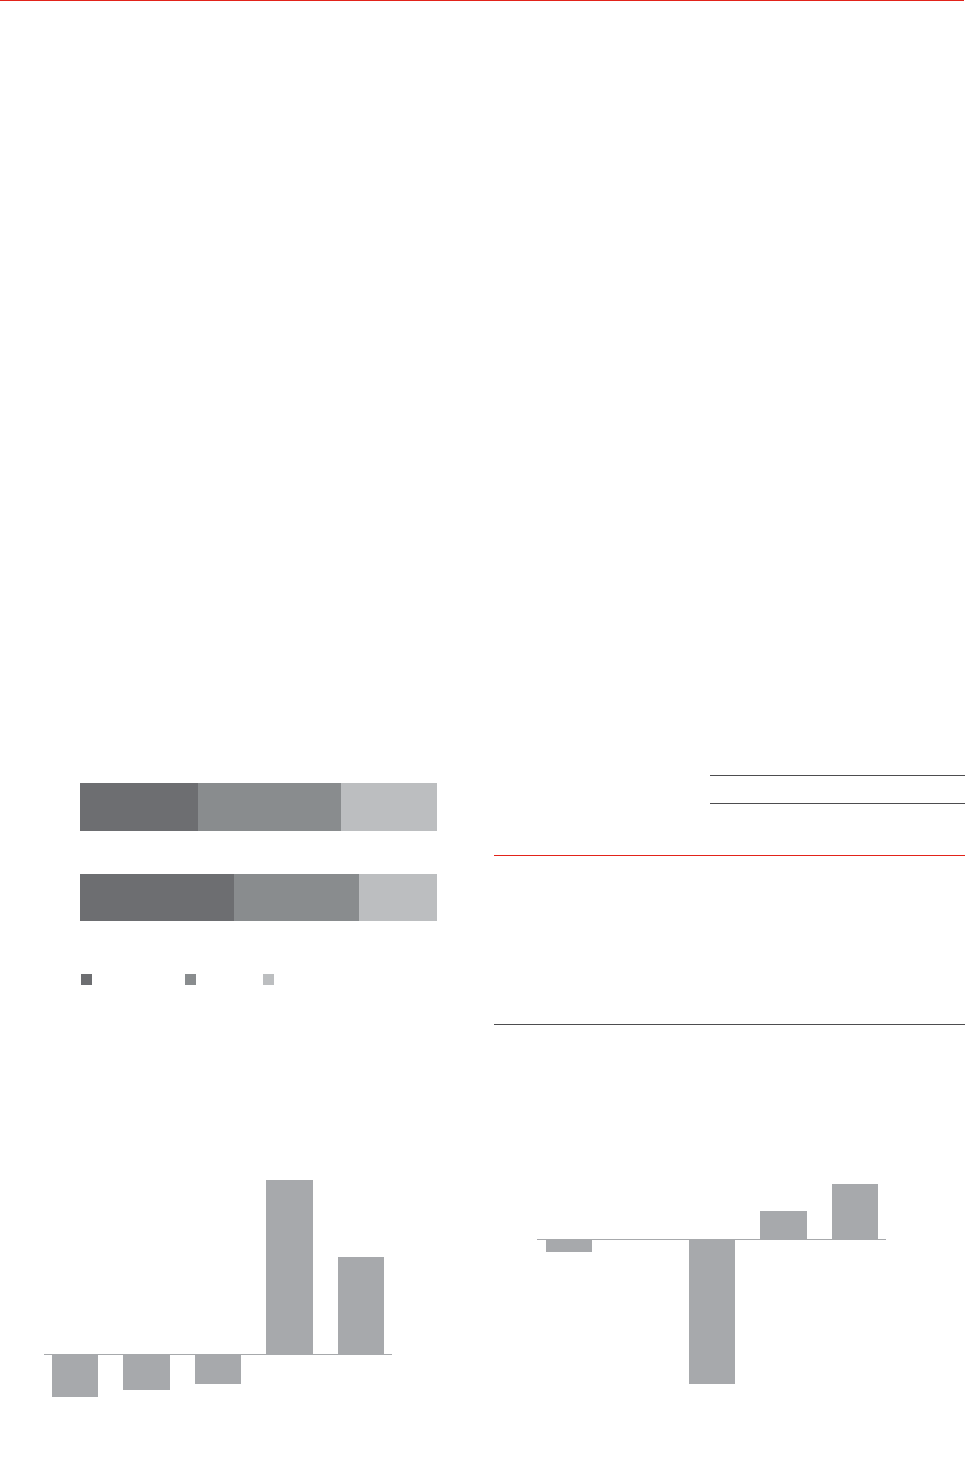
Target Remuneration Mix for 2015/2016
0%20%40%60%80%100%
CEO
Base Pay
Other
Executives
33%
43%35%22%
40%27%
STIP LTIP1
1. Based on the value granted during the year, determined using the fair value of rights at
start of the performance period.
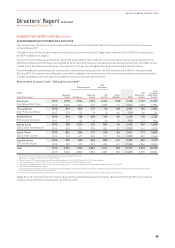
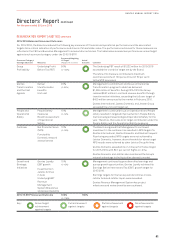
Statutory Remuneration Mix for 2015/2016
Performance-related Remuneration
Cash-based Equity-settled Share-based
Base Pay &
Other
%
Cash
Incentives
%
Deferred
Shares
%
LTIP
%
Alan Joyce 24 39 10 27
Tino La Spina 41 37 814
Andrew David 35 31 20 14
Gareth Evans 35 34 823
Lesley Grant 38 36 917
Jayne Hrdlicka 38 31 823
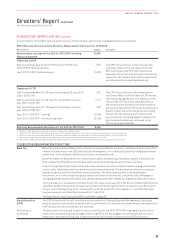
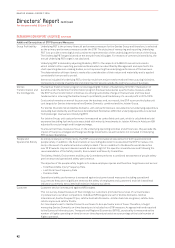
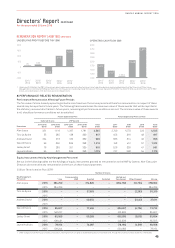
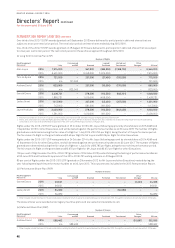
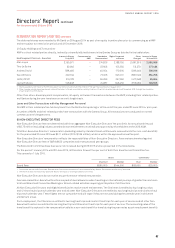
Qantas Financial Performance History
To provide further context on Qantas’ performance, the following graphs outline a five year history of key financial metrics.
QANTAS THREE YEAR ROLLING TSR PERFORMANCE (%)
-50%
0%
50%
100
%
150
%
200
%
2011/
2012
2012/
2013
2013/
2014
2014/
2015
2015/
2016
(47%)(39%)(32%)
194%
109%
EARNINGS PER SHARE (CENTS)
-140
-120
-100
-80
-60
-40
-20
0
20
40
60
2011/
2012 2012/
2013 2013/
2014 2014/
2015 2015/
2016
(10.8)
0.04
(128.5)
25.4
49.4
44
QANTAS ANNUAL REPORT 2016