Qantas 2016 Annual Report Download - page 62
Download and view the complete annual report
Please find page 62 of the 2016 Qantas annual report below. You can navigate through the pages in the report by either clicking on the pages listed below, or by using the keyword search tool below to find specific information within the annual report.-
 1
1 -
2
-
3
-
4
-
5
-
6
-
7
-
8
-
9
-
10
-
11
-
12
-
13
-
14
-
15
-
16
-
17
-
18
-
19
-
20
-
21
-
22
-
23
-
24
-
25
-
26
-
27
-
28
-
29
-
30
-
31
-
32
-
33
-
34
-
35
-
36
-
37
-
38
-
39
-
40
-
41
-
42
-
43
-
44
-
45
-
46
-
47
-
48
-
49
-
50
-
51
-
 52
52 -
 53
53 -
 54
54 -
 55
55 -
 56
56 -
 57
57 -
 58
58 -
 59
59 -
 60
60 -
 61
61 -
 62
62 -
 63
63 -
 64
64 -
 65
65 -
 66
66 -
 67
67 -
 68
68 -
 69
69 -
 70
70 -
 71
71 -
 72
72 -
73
-
74
-
75
-
76
-
77
-
78
-
79
-
80
-
81
-
82
-
83
-
84
-
85
-
86
-
87
-
88
-
89
-
90
-
91
-
92
-
93
-
94
-
95
-
96
-
97
-
98
-
99
-
100
-
101
-
102
-
103
-
104
-
105
-
106
 |
 |

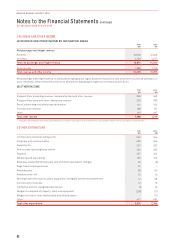
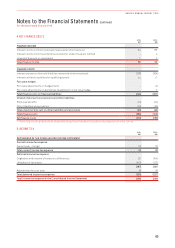
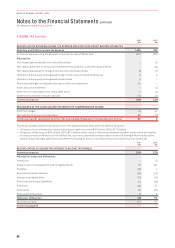
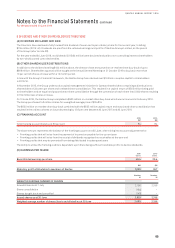
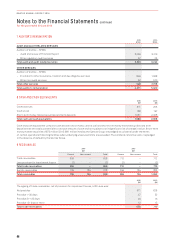
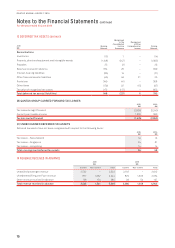
Notes to the Financial Statements continued
For the year ended 30 June 2016
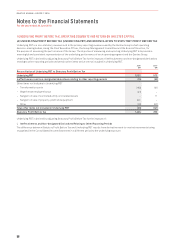
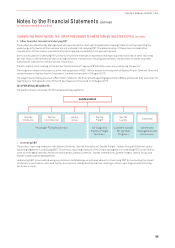
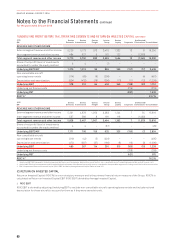
1 UNDERLYING PROFIT BEFORE TAX, OPERATING SEGMENTS AND RETURN ON INVESTED CAPITAL CONTINUED
2016
$M
Qantas
Domestic
Qantas
International
Qantas
Freight
Jetstar
Group
Qantas
Loyalty Corporate
Unallocated/
Eliminations2Consolidated
REVENUE AND OTHER INCOME
External segment revenue and other income 5,226 5,173 973 3,475 1,332 13 816,200
Inter-segment revenue and other income 484 577 9161 122 –(1,353) –
Total segment revenue and other income 5,710 5,750 982 3,636 1,454 13 (1,345) 16,200
Share of net profit/(loss) of investments
accounted for under the equity method 3 4 – (7) – – – –
Underlying EBITDAR11,276 1,013 96 866 359 (157) (17) 3,436
Non-cancellable aircraft
operating lease rentals (174) (69) (6) (208) – – (4) (461)
Depreciation and amortisation (524) (432) (26) (206) (13) (11) (12) (1,224)
Underlying EBIT 578 512 64 452 346 (168) (33) 1,751
Underlying net finance costs (219) (219)
Underlying PBT (387) 1,532
ROIC %322.7%
2015
$M
Qantas
Domestic
Qantas
International
Qantas
Freight
Jetstar
Group
Qantas
Loyalty Corporate
Unallocated/
Eliminations2Consolidated
REVENUE AND OTHER INCOME
External segment revenue and other income
5,291 4,878 1,059 3,283 1,244 754 15,816
Inter-segment revenue and other income 537 589 8181 118 –(1,433) –
Total segment revenue and other income 5,828 5,467 1,067 3,464 1,362 7(1,379) 15,816
Share of net profit/(loss) of investments
accounted for under the equity method 4 4 – (37) – – – (29)
Underlying EBITDAR11,171 706 156 625 323 (150) (7) 2,824
Non-cancellable aircraft
operating lease rentals (219) (42) (5) (229) – – – (495)
Depreciation and amortisation (472) (397) (37) (166) (8) (13) (3) (1,096)
Underlying EBIT 480 267 114 230 315 (163) (10) 1,233
Underlying net finance costs (258) (258)
Underlying PBT (421) 975
ROIC %316.2%
1 Underlying EBITDAR represents Underlying earnings before income tax expense, depreciation, amortisation, non-cancellable aircraft operating lease rentals and net finance costs.
2 Unallocated/Eliminations represents unallocated and other businesses of the Qantas Group which are not considered to be reportable segments including consolidation elimination entries.
3 ROIC % represents Return on Invested Capital (ROIC) EBIT divided by Average Invested Capital (Refer to Note 1(C)).
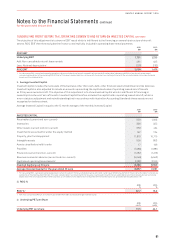
(C) RETURN ON INVESTED CAPITAL
Return on Invested Capital (ROIC %) is a non-statutory measure and is the primary financial return measure of the Group. ROIC % is
calculated as Return on Invested Capital EBIT (ROIC EBIT) divided by Average Invested Capital.
i. ROIC EBIT
ROIC EBIT is derived by adjusting Underlying EBIT to exclude non-cancellable aircraft operating lease rentals and include notional
depreciation for these aircraft to account for them as if they were owned aircraft.
60
QANTAS ANNUAL REPORT 2016