Qantas 2016 Annual Report Download - page 73
Download and view the complete annual report
Please find page 73 of the 2016 Qantas annual report below. You can navigate through the pages in the report by either clicking on the pages listed below, or by using the keyword search tool below to find specific information within the annual report.
Notes to the Financial Statements continued
For the year ended 30 June 2016
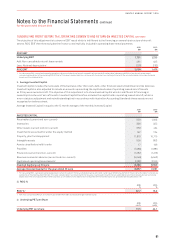
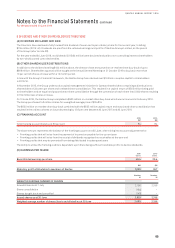
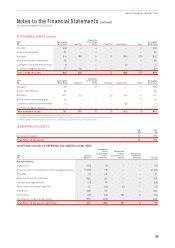
15 INTEREST-BEARING LIABILITIES
2016
$M
2015
$M
Notes Current Non-current Total Current Non-current Total
Bank loans – secured 297 1,793 2,090 304 2,083 2,387
Bank loans – unsecured –276 276 –273 273
Other loans – unsecured 41 986 1,027 374 1,030 1,404
Lease and hire purchase liabilities – secured 22 103 1,366 1,469 93 1,405 1,498
Total interest–bearing liabilities 441 4,421 4,862 771 4,791 5,562
Certain current and non-current interest-bearing liabilities relate to specific financings of aircraft and engines and are secured by
the aircraft to which they relate (refer to Note 11). During the year, there were non-cash financing activities relating to additions of
property, plant and equipment under finance leases of $32 million (2015: $30 million).
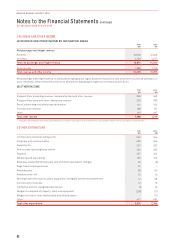
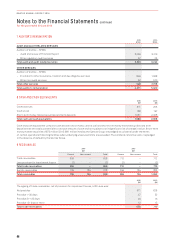
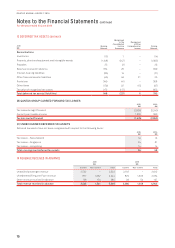
16 PROVISIONS
2016
$M
2015
$M
Current Non-current Total Current Non-current Total
Annual leave 276 –276 253 –253
Long service leave 346 58 404 291 41 332
Redundancies and other employee benefits 192 –192 138 –138
Defined benefit liability –24 24 –––
Total employee benefits 814 82 896 682 41 723
Onerous contracts 1 3 4 1 2 3
Make good on leased assets 2172 174 63 211 274
Insurance, legal and other 56 157 213 72 141 213
Total other provisions 59 332 391 136 354 490
Total provisions 873 414 1,287 818 395 1,213
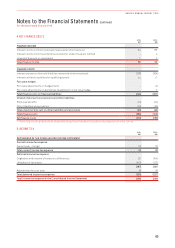
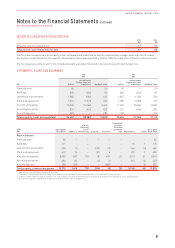
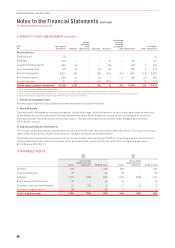
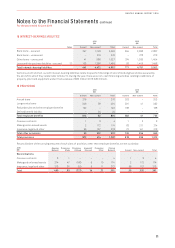
Reconciliations of the carrying amounts of each class of provision, other than employee benefits, are set out below:
2016
$M
Opening
Balance
Provisions
Made
Provisions
Utilised
Unwind of
Discount
Provisions
Other
Closing
Balance Current Non-current Total
Reconciliations
Onerous contracts 3 1 – – – 4 1 3 4
Make good on leased assets 274 47 (166) 910 174 2172 174
Insurance, legal and other 213 35 (51) 511 213 56 157 213
Total 490 83 (217) 14 21 391 59 332 391
71
QANTAS ANNUAL REPORT 2016


