Qantas 2016 Annual Report Download - page 19
Download and view the complete annual report
Please find page 19 of the 2016 Qantas annual report below. You can navigate through the pages in the report by either clicking on the pages listed below, or by using the keyword search tool below to find specific information within the annual report.-
 1
1 -
2
-
3
-
4
-
5
-
6
-
7
-
8
-
 9
9 -
 10
10 -
 11
11 -
 12
12 -
 13
13 -
 14
14 -
 15
15 -
 16
16 -
 17
17 -
 18
18 -
 19
19 -
 20
20 -
 21
21 -
 22
22 -
 23
23 -
 24
24 -
 25
25 -
 26
26 -
 27
27 -
 28
28 -
 29
29 -
30
-
31
-
32
-
33
-
34
-
35
-
36
-
37
-
38
-
39
-
40
-
41
-
42
-
43
-
44
-
45
-
46
-
47
-
48
-
49
-
50
-
51
-
52
-
53
-
54
-
55
-
56
-
57
-
58
-
59
-
60
-
61
-
62
-
63
-
64
-
65
-
66
-
67
-
68
-
69
-
70
-
71
-
72
-
73
-
74
-
75
-
76
-
77
-
78
-
79
-
80
-
81
-
82
-
83
-
84
-
85
-
86
-
87
-
88
-
89
-
90
-
91
-
92
-
93
-
94
-
95
-
96
-
97
-
98
-
99
-
100
-
101
-
102
-
103
-
104
-
105
-
106
 |
 |

Review of Operations continued
For the year ended 30 June 2016
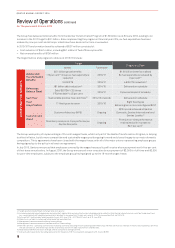
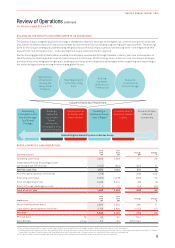
BUILDING ON THE GROUP’S LONG-TERM COMPETITIVE ADVANTAGES
The Qantas Group’s integrated portfolio strategy is designed to diversify earnings and mitigate risk, with the dual brands of Qantas
and Jetstar and their presence in attractive markets across the Asia Pacific providing long-term growth opportunities. The starting
point for the Group’s strategy is understanding the global forces that will impact Qantas over the long-term – the megatrends that
present both risk and opportunity – and ensuring the Group is well positioned to respond.
Qantas has engaged with stakeholders including shareholders, sustainability thought leaders, industry partners and suppliers to
identify and prioritise the global forces of most relevance to the Group. With this long-term context in mind, the Group’s strategic
priorities allow us to navigate the right path, building on our long-term competitive advantages while recognising and responding to
the risks and opportunities arising from emerging global forces.
New Centres
of Customer
Demand &
Geopolitical
Influence
Rapid Digitisation
& the Rise of Big
Data
Shifting
Customer
& Workforce
Preferences
Resource
Constraints &
Climate Change
CLEAR STRATEGIC PRIORITIES
Maximising
Leading Domestic
Position through
Dual Brand
Strategy
Investing in
Customer, Brand,
Data & Digital
Focus on People,
Culture &
Leadership
Building a
Resilient &
Sustainable
Qantas
International,
Growing Efficiently
with Partnerships
Aligning Qantas
& Jetstar with
Asia’s Growth
Diversification &
Growth at Qantas
Loyalty
Embedding Sustainability Across Qantas Group
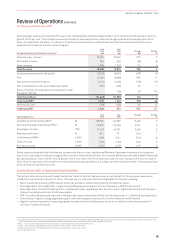
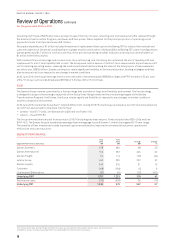
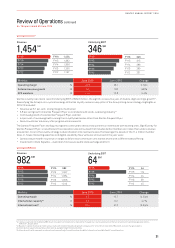
RAPIDLY IMPROVED CASH GENERATION
Cash Flow Summary
June
2016
$M
June
2015
$M
Change
$M
Change
%
Operating cash flows 2,819 2,048 771 38
Investing cash flows (excluding aircraft
operating lease refinancing) (1,145) (944) (201) 21
Net free cash flow 1,674 1,104 570 52
Aircraft operating lease refinancing (778) –(778) >100
Financing cash flows (1,825) (1,218) (607) 50
Cash at beginning of year 2,908 3,001 (93) (3)
Effect of foreign exchange on cash 121 (20) (95)
Cash at end of year 1,980 2,908 (928) (32)
Debt Analysis
June
2016
$M
June
2015
$M
Change Change
%
Net on balance sheet debt32 2,880 2,594 286 11
Capitalised operating lease liabilities33 2,766 3,806 (1,040) (27)
Net debt34 5,646 6,400 (754) (12)
FFO/net debt %52 45 7pts
Debt/EBITDA times 2.5 3.0 (0.5) times
32 Net on balance sheet debt includes interest-bearing liabilities and the fair value of hedges related to debt reduced by cash and cash equivalents.
33 Capitalised operating lease liabilities are measured at fair value at the lease commencement date and remeasured over the lease term on a principal and interest basis akin to a finance
lease. Residual value of capitalised aircraft operating lease liability denominated in foreign currency is translated at the long-term exchange rate.
34 Net debt includes on balance sheet debt and capitalised aircraft operating lease liabilities under the Group’s Financial Framework.
17
QANTAS ANNUAL REPORT 2016