Kroger 2014 Annual Report Download - page 90
Download and view the complete annual report
Please find page 90 of the 2014 Kroger annual report below. You can navigate through the pages in the report by either clicking on the pages listed below, or by using the keyword search tool below to find specific information within the annual report.-
 1
1 -
2
-
3
-
4
-
5
-
6
-
7
-
8
-
9
-
10
-
11
-
12
-
13
-
14
-
15
-
16
-
17
-
18
-
19
-
20
-
21
-
22
-
23
-
24
-
25
-
26
-
27
-
28
-
29
-
30
-
31
-
32
-
33
-
34
-
35
-
36
-
37
-
38
-
39
-
40
-
41
-
42
-
43
-
44
-
45
-
46
-
47
-
48
-
49
-
50
-
51
-
52
-
53
-
54
-
55
-
56
-
57
-
58
-
59
-
60
-
61
-
62
-
63
-
64
-
65
-
66
-
67
-
68
-
69
-
70
-
71
-
72
-
73
-
74
-
75
-
76
-
77
-
78
-
79
-
 80
80 -
 81
81 -
 82
82 -
 83
83 -
 84
84 -
 85
85 -
 86
86 -
 87
87 -
 88
88 -
 89
89 -
 90
90 -
 91
91 -
 92
92 -
 93
93 -
 94
94 -
 95
95 -
 96
96 -
 97
97 -
 98
98 -
 99
99 -
 100
100 -
101
-
102
-
103
-
104
-
105
-
106
-
107
-
108
-
109
-
110
-
111
-
112
-
113
-
114
-
115
-
116
-
117
-
118
-
119
-
120
-
121
-
122
-
123
-
124
-
125
-
126
-
127
-
128
-
129
-
130
-
131
-
132
-
133
-
134
-
135
-
136
-
137
-
138
-
139
-
140
-
141
-
142
 |
 |

A-25
facility could be affected by an increase in our Leverage Ratio. As of March 27, 2015, we had $1.0 billion of CP
borrowings outstanding. The decrease as of March 27, 2015, compared to year-end 2014, was due to applying
cash from operations against our year-end CP outstanding borrowings.
Our credit facility requires the maintenance of a Leverage Ratio and a Fixed Charge Coverage Ratio (our
“financial covenants”). A failure to maintain our financial covenants would impair our ability to borrow under
the credit facility. These financial covenants and ratios are described below:
• OurLeverageRatio(theratioofNetDebttoConsolidatedEBITDA,asdefinedinthecreditfacility)was
2.06 to 1 as of January 31, 2015. If this ratio were to exceed 3.50 to 1, we would be in default of our
credit facility and our ability to borrow under the facility would be impaired. In addition, our Applicable
Margin on borrowings is determined by our Leverage Ratio.
• OurFixedChargeCoverageRatio(theratioofConsolidatedEBITDAplusConsolidatedRentalExpenseto
Consolidated Cash Interest Expense plus Consolidated Rental Expense, as defined in the credit facility)
was 4.99 to 1 as of January 31, 2015. If this ratio fell below 1.70 to 1, we would be in default of our credit
facility and our ability to borrow under the facility would be impaired.
Our credit agreement is more fully described in Note 6 to the Consolidated Financial Statements. We
were in compliance with our financial covenants at year-end 2014.
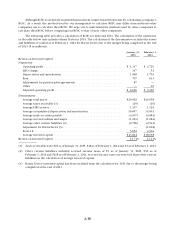
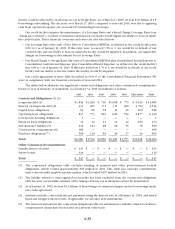
The tables below illustrate our significant contractual obligations and other commercial commitments,
based on year of maturity or settlement, as of January 31, 2015 (in millions of dollars):
2015 2016 2017 2018 2019 Thereafter Total
Contractual Obligations (1) (2)
Long-term debt (3) . . . . . . . . . . . . . . . . . . $1,844 $1,299 $ 736 $1,008 $ 773 $ 5,425 $11,085
Interest on long-term debt (4). . . . . . . . . . 431 405 371 335 299 2,700 4,541
Capital lease obligations . . . . . . . . . . . . . . 63 60 58 49 45 409 684
Operating lease obligations . . . . . . . . . . . 837 773 699 629 554 2,877 6,369
Low-income housing obligations . . . . . . . 1 — — — — — 1
Financed lease obligations . . . . . . . . . . . . 14 14 14 14 14 104 174
Self-insurance liability (5) . . . . . . . . . . . . . 216 123 88 58 35 79 599
Construction commitments (6) . . . . . . . . 366 — — — — — 366
Purchase obligations (7) . . . . . . . . . . . . . . 509 116 84 45 37 44 835
Total . . . . . . . . . . . . . . . . . . . . . . . . . . . . . $4,281 $2,790 $2,050 $2,138 $1,757 $11,638 $24,654
Other Commercial Commitments
Standby letters of credit . . . . . . . . . . . . . . $ 233 $ — $ — $ — $ — $ — $ 233
Surety bonds . . . . . . . . . . . . . . . . . . . . . . . 314 — — — — — 310
Total . . . . . . . . . . . . . . . . . . . . . . . . . . . . . $ 547 $ — $ — $ — $ — $ — $ 547
(1) The contractual obligations table excludes funding of pension and other postretirement benefit
obligations, which totaled approximately $25 million in 2014. This table also excludes contributions
under various multi-employer pension plans, which totaled $297 million in 2014.
(2) The liability related to unrecognized tax benefits has been excluded from the contractual obligations
table because a reasonable estimate of the timing of future tax settlements cannot be determined.
(3) As of January 31, 2015, we had $1.3 billion of borrowings of commercial paper and no borrowings under
our credit agreement.
(4) Amounts include contractual interest payments using the interest rate as of January 31, 2015, and stated
fixed and swapped interest rates, if applicable, for all other debt instruments.
(5) The amounts included in the contractual obligations table for self-insurance liability related to workers’
compensation claims have been stated on a present value basis.