Kroger 2014 Annual Report Download - page 75
Download and view the complete annual report
Please find page 75 of the 2014 Kroger annual report below. You can navigate through the pages in the report by either clicking on the pages listed below, or by using the keyword search tool below to find specific information within the annual report.-
 1
1 -
2
-
3
-
4
-
5
-
6
-
7
-
8
-
9
-
10
-
11
-
12
-
13
-
14
-
15
-
16
-
17
-
18
-
19
-
20
-
21
-
22
-
23
-
24
-
25
-
26
-
27
-
28
-
29
-
30
-
31
-
32
-
33
-
34
-
35
-
36
-
37
-
38
-
39
-
40
-
41
-
42
-
43
-
44
-
45
-
46
-
47
-
48
-
49
-
50
-
51
-
52
-
53
-
54
-
55
-
56
-
57
-
58
-
59
-
60
-
61
-
62
-
63
-
64
-
 65
65 -
 66
66 -
 67
67 -
 68
68 -
 69
69 -
 70
70 -
 71
71 -
 72
72 -
 73
73 -
 74
74 -
 75
75 -
 76
76 -
 77
77 -
 78
78 -
 79
79 -
 80
80 -
 81
81 -
 82
82 -
 83
83 -
 84
84 -
 85
85 -
86
-
87
-
88
-
89
-
90
-
91
-
92
-
93
-
94
-
95
-
96
-
97
-
98
-
99
-
100
-
101
-
102
-
103
-
104
-
105
-
106
-
107
-
108
-
109
-
110
-
111
-
112
-
113
-
114
-
115
-
116
-
117
-
118
-
119
-
120
-
121
-
122
-
123
-
124
-
125
-
126
-
127
-
128
-
129
-
130
-
131
-
132
-
133
-
134
-
135
-
136
-
137
-
138
-
139
-
140
-
141
-
142
 |
 |

A-10
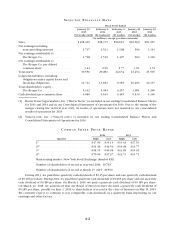
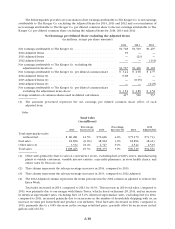
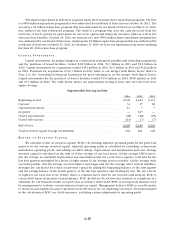
The following table provides a reconciliation of net earnings attributable to The Kroger Co. to net earnings
attributable to The Kroger Co. excluding the Adjusted Items for 2014, 2013 and 2012 and a reconciliation of
net earnings attributable to The Kroger Co. per diluted common share to the net earnings attributable to The
Kroger Co. per diluted common share excluding the Adjusted Items for 2014, 2013 and 2012:
Net Earnings per Diluted Share excluding the Adjusted Items
(in millions, except per share amounts)
2014 2013 2012
Net earnings attributable to The Kroger Co. . . . . . . . . . . . . . . . . . . . . . . . . . . $ 1,728 $ 1,519 $1,497
2014 Adjusted Items . . . . . . . . . . . . . . . . . . . . . . . . . . . . . . . . . . . . . . . . . . . . . 39 — —
2013 Adjusted Items . . . . . . . . . . . . . . . . . . . . . . . . . . . . . . . . . . . . . . . . . . . . . — (23) —
2012 Adjusted Items . . . . . . . . . . . . . . . . . . . . . . . . . . . . . . . . . . . . . . . . . . . . . — — (132)
Net earnings attributable to The Kroger Co. excluding the
adjustment items above . . . . . . . . . . . . . . . . . . . . . . . . . . . . . . . . . . . . . . . . $1,767 $1,496 $1,365
Net earnings attributable to The Kroger Co. per diluted common share . . . . $ 3.44 $ 2.90 $ 2.77
2014 Adjusted Items (1) . . . . . . . . . . . . . . . . . . . . . . . . . . . . . . . . . . . . . . . . . . . 0.08 — —
2013 Adjusted Items (1) . . . . . . . . . . . . . . . . . . . . . . . . . . . . . . . . . . . . . . . . . . — (0.05) —
2012 Adjusted Items (1) . . . . . . . . . . . . . . . . . . . . . . . . . . . . . . . . . . . . . . . . . . — — (0.25)
Net earnings attributable to The Kroger Co. per diluted common share
excluding the adjustment items above . . . . . . . . . . . . . . . . . . . . . . . . . . . . $ 3.52 $ 2.85 $ 2.52
Average numbers of common shares used in diluted calculation . . . . . . . . . . 497 520 537
(1) The amounts presented represent the net earnings per diluted common share effect of each
adjusted item.
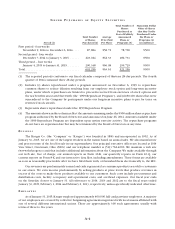
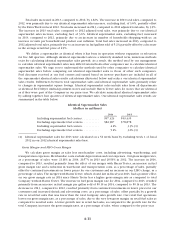
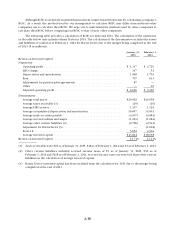
Sales
Total Sales
(in millions)
2014
Percentage
Increase (2) 2013
Percentage
Increase (3) 2012
2012
Adjusted (4)
Total supermarket sales
without fuel . . . . . . . . . . . . . . . . $ 86,281 12.5% $76,666 4.0% $75,179 $73,733
Fuel sales . . . . . . . . . . . . . . . . . . . . . 18,850 (0.6%) 18,962 3.0% 18,896 18,413
Other sales (1) . . . . . . . . . . . . . . . . . 3,334 21.4% 2,747 9.2% 2,544 2,515
Total sales . . . . . . . . . . . . . . . . . . . . $108,465 10.3% $98,375 3.9% $96,619 $94,661
(1) Other sales primarily relate to sales at convenience stores, excluding fuel; jewelry stores; manufacturing
plants to outside customers; variable interest entities; a specialty pharmacy; in-store health clinics; and
online sales by Vitacost.com.
(2) This column represents the sales percentage increases in 2014, compared to 2013.
(3) This column represents the sales percentage increases in 2013, compared to 2012 Adjusted.
(4) The 2012 Adjusted column represents the items presented in the 2012 column as adjusted to remove the
Extra Week.
Total sales increased in 2014, compared to 2013, by 10.3%. This increase in 2014 total sales, compared to
2013, was primarily due to our merger with Harris Teeter, which closed on January 28, 2014, and an increase
in identical supermarket sales, excluding fuel, of 5.2%. Identical supermarket sales, excluding fuel for 2014,
compared to 2013, increased primarily due to an increase in the number of households shopping with us, an
increase in visits per household and product cost inflation. Total fuel sales decreased in 2014, compared to
2013, primarily due to a 6.8% decrease in the average retail fuel price, partially offset by an increase in fuel
gallons sold of 6.6%.