Kroger 2014 Annual Report Download - page 68
Download and view the complete annual report
Please find page 68 of the 2014 Kroger annual report below. You can navigate through the pages in the report by either clicking on the pages listed below, or by using the keyword search tool below to find specific information within the annual report.-
 1
1 -
2
-
3
-
4
-
5
-
6
-
7
-
8
-
9
-
10
-
11
-
12
-
13
-
14
-
15
-
16
-
17
-
18
-
19
-
20
-
21
-
22
-
23
-
24
-
25
-
26
-
27
-
28
-
29
-
30
-
31
-
32
-
33
-
34
-
35
-
36
-
37
-
38
-
39
-
40
-
41
-
42
-
43
-
44
-
45
-
46
-
47
-
48
-
49
-
50
-
51
-
52
-
53
-
54
-
55
-
56
-
57
-
 58
58 -
 59
59 -
 60
60 -
 61
61 -
 62
62 -
 63
63 -
 64
64 -
 65
65 -
 66
66 -
 67
67 -
 68
68 -
 69
69 -
 70
70 -
 71
71 -
 72
72 -
 73
73 -
 74
74 -
 75
75 -
 76
76 -
 77
77 -
 78
78 -
79
-
80
-
81
-
82
-
83
-
84
-
85
-
86
-
87
-
88
-
89
-
90
-
91
-
92
-
93
-
94
-
95
-
96
-
97
-
98
-
99
-
100
-
101
-
102
-
103
-
104
-
105
-
106
-
107
-
108
-
109
-
110
-
111
-
112
-
113
-
114
-
115
-
116
-
117
-
118
-
119
-
120
-
121
-
122
-
123
-
124
-
125
-
126
-
127
-
128
-
129
-
130
-
131
-
132
-
133
-
134
-
135
-
136
-
137
-
138
-
139
-
140
-
141
-
142
 |
 |
A-3
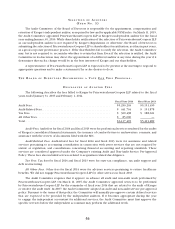
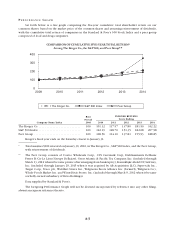
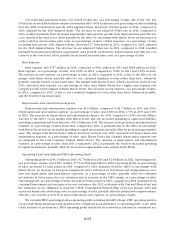
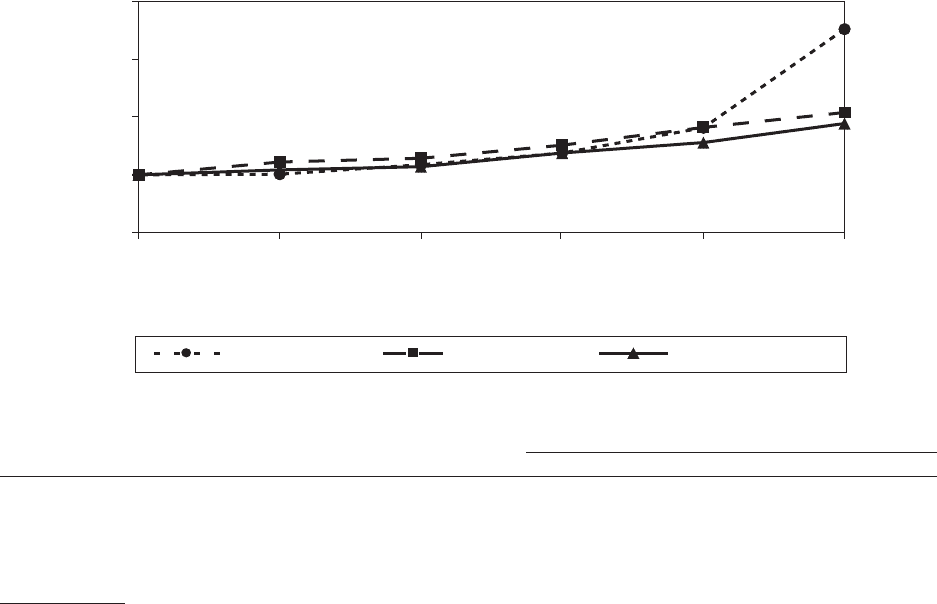
PE R F O R M A N C E G R A P H
Set forth below is a line graph comparing the five-year cumulative total shareholder return on our
common shares, based on the market price of the common shares and assuming reinvestment of dividends,
with the cumulative total return of companies in the Standard & Poor’s 500 Stock Index and a peer group
composed of food and drug companies.
2009 2010 2011 2012 2013 2014
The Kroger Co. S&P 500 Index Peer Group
COMPARISON OF CUMULATIVE FIVE-YEAR TOTAL RETURN*
Among The Kroger Co., the S&P 500, and Peer Group**
0
100
200
300
400
Company Name/Index
Base
Period
2009
INDEXED RETURNS
Years Ending
2010 2011 2012 2013 2014
The Kroger Co. . . . . . . . . . . . . . . . . . . . . . . . . . . . 100 101.12 117.57 137.80 181.50 352.22
S&P 500 Index . . . . . . . . . . . . . . . . . . . . . . . . . . . 100 122.19 128.70 151.35 182.08 207.98
Peer Group . . . . . . . . . . . . . . . . . . . . . . . . . . . . . . 100 108.56 114.10 137.81 155.93 188.85
Kroger’s fiscal year ends on the Saturday closest to January 31.
* Total assumes $100 invested on January 30, 2010, in The Kroger Co., S&P 500 Index, and the Peer Group,
with reinvestment of dividends.
** The Peer Group consists of Costco Wholesale Corp., CVS Caremark Corp, Etablissements Delhaize
Freres Et Cie Le Lion (Groupe Delhaize), Great Atlantic & Pacific Tea Company, Inc. (included through
March 13, 2012 when it became private after emerging from bankruptcy), Koninklijke Ahold NV, Safeway,
Inc. (included through January 29, 2015 when it was acquired by AB Acquisition LLC), Supervalu Inc.,
Target Corp., Tesco plc, Wal-Mart Stores Inc., Walgreens Boots Alliance Inc. (formerly, Walgreen Co.),
Whole Foods Market Inc. and Winn-Dixie Stores, Inc. (included through March 9, 2012 when it became
a wholly-owned subsidiary of Bi-Lo Holdings).
Data supplied by Standard & Poor’s.
The foregoing Performance Graph will not be deemed incorporated by reference into any other filing,
absent an express reference thereto.