Kroger 2014 Annual Report Download - page 131
Download and view the complete annual report
Please find page 131 of the 2014 Kroger annual report below. You can navigate through the pages in the report by either clicking on the pages listed below, or by using the keyword search tool below to find specific information within the annual report.-
 1
1 -
2
-
3
-
4
-
5
-
6
-
7
-
8
-
9
-
10
-
11
-
12
-
13
-
14
-
15
-
16
-
17
-
18
-
19
-
20
-
21
-
22
-
23
-
24
-
25
-
26
-
27
-
28
-
29
-
30
-
31
-
32
-
33
-
34
-
35
-
36
-
37
-
38
-
39
-
40
-
41
-
42
-
43
-
44
-
45
-
46
-
47
-
48
-
49
-
50
-
51
-
52
-
53
-
54
-
55
-
56
-
57
-
58
-
59
-
60
-
61
-
62
-
63
-
64
-
65
-
66
-
67
-
68
-
69
-
70
-
71
-
72
-
73
-
74
-
75
-
76
-
77
-
78
-
79
-
80
-
81
-
82
-
83
-
84
-
85
-
86
-
87
-
88
-
89
-
90
-
91
-
92
-
93
-
94
-
95
-
96
-
97
-
98
-
99
-
100
-
101
-
102
-
103
-
104
-
105
-
106
-
107
-
108
-
109
-
110
-
111
-
112
-
113
-
114
-
115
-
116
-
117
-
118
-
119
-
120
-
 121
121 -
 122
122 -
 123
123 -
 124
124 -
 125
125 -
 126
126 -
 127
127 -
 128
128 -
 129
129 -
 130
130 -
 131
131 -
 132
132 -
 133
133 -
 134
134 -
 135
135 -
 136
136 -
 137
137 -
 138
138 -
 139
139 -
 140
140 -
 141
141 -
142
 |
 |

A-66
NO T E S T O C O N S O L I D A T E D F I N A N C I A L S T A T E M E N T S , CO N T I N U E D
assets are reallocated or rebalanced periodically. In addition, cash flow from employer contributions and
participant benefit payments can be used to fund underweight asset classes and divest overweight asset
classes, as appropriate. The Company expects that cash flow will be sufficient to meet most rebalancing needs.
The Company is not required and does not expect to make any contributions to the Qualified Plans
in 2015. If the Company does make any contributions in 2015, the Company expects these contributions
will decrease its required contributions in future years. Among other things, investment performance of
plan assets, the interest rates required to be used to calculate the pension obligations, and future changes
in legislation, will determine the amounts of any contributions. The Company expects 2015 expense for
Company-sponsored pension plans to be approximately $90. In addition, the Company expects 401(k)
retirement savings account plans cash contributions and expense from automatic and matching contributions
to participants to be approximately $180 in 2015.
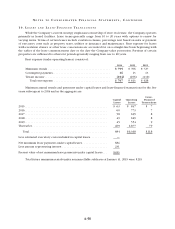
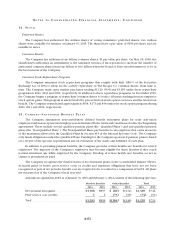
Assumed health care cost trend rates have a significant effect on the amounts reported for the health care
plans. The Company used a 7.00% initial health care cost trend rate, which is assumed to decrease on a linear
basis to a 4.50% ultimate health care cost trend rate in 2028, to determine its expense. A one-percentage-point
change in the assumed health care cost trend rates would have the following effects:
1% Point
Increase
1% Point
Decrease
Effect on total of service and interest cost components ......................... $ 3 $ (3)
Effect on postretirement benefit obligation ................................... $30 $(26)
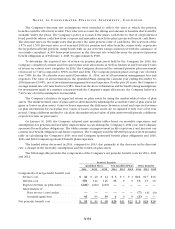
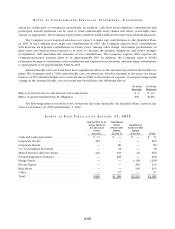
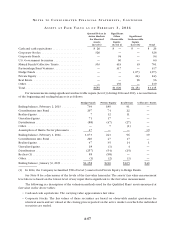
The following tables set forth by level, within the fair value hierarchy, the Qualified Plans’ assets at fair
value as of January 31, 2015 and February 1, 2014:
AS S E T S A T F A I R VA L U E A S O F J A N U A R Y 3 1 , 2 0 15
Quoted Prices in
Active Markets
for Identical
Assets
(Level 1)
Significant
Other
Observable
Inputs
(Level 2)
Significant
Unobservable
Inputs
(Level 3) Total
Cash and cash equivalents . . . . . . . . . . . . . . . . . . . $ 73 $ — $ — $ 73
Corporate Stocks . . . . . . . . . . . . . . . . . . . . . . . . . . . 294 — — 294
Corporate Bonds . . . . . . . . . . . . . . . . . . . . . . . . . . . — 80 — 80
U.S. Government Securities . . . . . . . . . . . . . . . . . . — 78 — 78
Mutual Funds/Collective Trusts . . . . . . . . . . . . . . . 123 503 40 666
Partnerships/Joint Ventures . . . . . . . . . . . . . . . . . . — 468 — 468
Hedge Funds . . . . . . . . . . . . . . . . . . . . . . . . . . . . . . — — 1,158 1,158
Private Equity . . . . . . . . . . . . . . . . . . . . . . . . . . . . . — — 210 210
Real Estate . . . . . . . . . . . . . . . . . . . . . . . . . . . . . . . . — — 105 105
Other . . . . . . . . . . . . . . . . . . . . . . . . . . . . . . . . . . . . — 57 — 57
Total. . . . . . . . . . . . . . . . . . . . . . . . . . . . . . . . . . . . . $490 $1,186 $1,513 $3,189