Kroger 2014 Annual Report Download - page 130
Download and view the complete annual report
Please find page 130 of the 2014 Kroger annual report below. You can navigate through the pages in the report by either clicking on the pages listed below, or by using the keyword search tool below to find specific information within the annual report.-
 1
1 -
2
-
3
-
4
-
5
-
6
-
7
-
8
-
9
-
10
-
11
-
12
-
13
-
14
-
15
-
16
-
17
-
18
-
19
-
20
-
21
-
22
-
23
-
24
-
25
-
26
-
27
-
28
-
29
-
30
-
31
-
32
-
33
-
34
-
35
-
36
-
37
-
38
-
39
-
40
-
41
-
42
-
43
-
44
-
45
-
46
-
47
-
48
-
49
-
50
-
51
-
52
-
53
-
54
-
55
-
56
-
57
-
58
-
59
-
60
-
61
-
62
-
63
-
64
-
65
-
66
-
67
-
68
-
69
-
70
-
71
-
72
-
73
-
74
-
75
-
76
-
77
-
78
-
79
-
80
-
81
-
82
-
83
-
84
-
85
-
86
-
87
-
88
-
89
-
90
-
91
-
92
-
93
-
94
-
95
-
96
-
97
-
98
-
99
-
100
-
101
-
102
-
103
-
104
-
105
-
106
-
107
-
108
-
109
-
110
-
111
-
112
-
113
-
114
-
115
-
116
-
117
-
118
-
119
-
 120
120 -
 121
121 -
 122
122 -
 123
123 -
 124
124 -
 125
125 -
 126
126 -
 127
127 -
 128
128 -
 129
129 -
 130
130 -
 131
131 -
 132
132 -
 133
133 -
 134
134 -
 135
135 -
 136
136 -
 137
137 -
 138
138 -
 139
139 -
 140
140 -
141
-
142
 |
 |

A-65
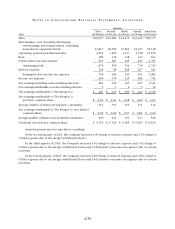
NO T E S T O C O N S O L I D A T E D F I N A N C I A L S T A T E M E N T S , CO N T I N U E D
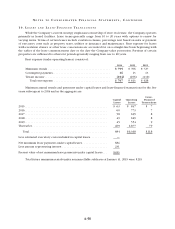
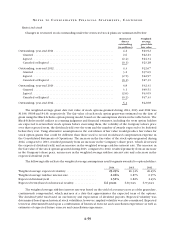
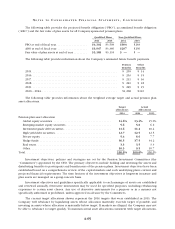
The following table provides the projected benefit obligation (“PBO”), accumulated benefit obligation
(“ABO”) and the fair value of plan assets for all Company-sponsored pension plans.
Qualified Plans Non-Qualified Plans
2014 2013 2014 2013
PBO at end of fiscal year . . . . . . . . . . . . . . . . . . . . $4,102 $3,509 $304 $263
ABO at end of fiscal year . . . . . . . . . . . . . . . . . . . . $3,947 $3,360 $297 $256
Fair value of plan assets at end of year . . . . . . . . . $3,189 $3,135 $ — $ —
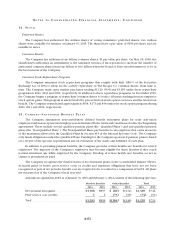
The following table provides information about the Company’s estimated future benefit payments.
Pension
Benefits
Other
Benefits
2015 . . . . . . . . . . . . . . . . . . . . . . . . . . . . . . . . . . . . . . . . . . . . . . . . . . . . . . . $ 205 $ 14
2016 . . . . . . . . . . . . . . . . . . . . . . . . . . . . . . . . . . . . . . . . . . . . . . . . . . . . . . . $ 203 $ 15
2017 . . . . . . . . . . . . . . . . . . . . . . . . . . . . . . . . . . . . . . . . . . . . . . . . . . . . . . . $ 211 $ 16
2018 . . . . . . . . . . . . . . . . . . . . . . . . . . . . . . . . . . . . . . . . . . . . . . . . . . . . . . . $ 221 $ 18
2019 . . . . . . . . . . . . . . . . . . . . . . . . . . . . . . . . . . . . . . . . . . . . . . . . . . . . . . . $ 229 $ 19
2020 – 2024 . . . . . . . . . . . . . . . . . . . . . . . . . . . . . . . . . . . . . . . . . . . . . . . . . $1,268 $110
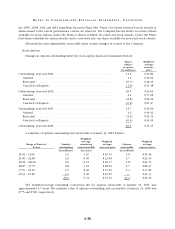
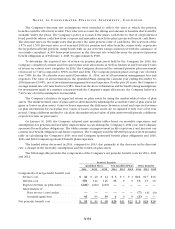
The following table provides information about the weighted average target and actual pension plan
asset allocations.
Target
allocations
Actual
Allocations
2014 2014 2013
Pension plan asset allocation
Global equity securities . . . . . . . . . . . . . . . . . . . . . . . . . . . . . . . . . . . . . 14.6% 13.4% 15.0%
Emerging market equity securities . . . . . . . . . . . . . . . . . . . . . . . . . . . . . 5.6 5.8 6.2
Investment grade debt securities . . . . . . . . . . . . . . . . . . . . . . . . . . . . . . 11.6 11.2 10.4
High yield debt securities . . . . . . . . . . . . . . . . . . . . . . . . . . . . . . . . . . . . 12.7 12.5 12.5
Private equity . . . . . . . . . . . . . . . . . . . . . . . . . . . . . . . . . . . . . . . . . . . . . 5.4 6.6 7.7
Hedge funds . . . . . . . . . . . . . . . . . . . . . . . . . . . . . . . . . . . . . . . . . . . . . . 36.5 37.5 34.2
Real estate . . . . . . . . . . . . . . . . . . . . . . . . . . . . . . . . . . . . . . . . . . . . . . . . 3.3 3.5 3.3
Other. . . . . . . . . . . . . . . . . . . . . . . . . . . . . . . . . . . . . . . . . . . . . . . . . . . . 10.3 9.5 10.7
Total . . . . . . . . . . . . . . . . . . . . . . . . . . . . . . . . . . . . . . . . . . . . . . . . . . . . . . . 100.0% 100.0% 100.0%
Investment objectives, policies and strategies are set by the Pension Investment Committees (the
“Committees”) appointed by the CEO. The primary objectives include holding and investing the assets and
distributing benefits to participants and beneficiaries of the pension plans. Investment objectives have been
established based on a comprehensive review of the capital markets and each underlying plan’s current and
projected financial requirements. The time horizon of the investment objectives is long-term in nature and
plan assets are managed on a going-concern basis.
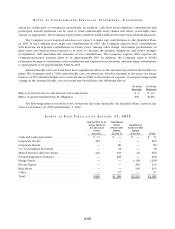
Investment objectives and guidelines specifically applicable to each manager of assets are established
and reviewed annually. Derivative instruments may be used for specified purposes, including rebalancing
exposures to certain asset classes. Any use of derivative instruments for a purpose or in a manner not
specifically authorized is prohibited, unless approved in advance by the Committees.
The current target allocations shown represent the 2014 targets that were established in 2013. The
Company will rebalance by liquidating assets whose allocation materially exceeds target, if possible, and
investing in assets whose allocation is materially below target. If markets are illiquid, the Company may not
be able to rebalance to target quickly. To maintain actual asset allocations consistent with target allocations,