Kroger 2014 Annual Report Download - page 73
Download and view the complete annual report
Please find page 73 of the 2014 Kroger annual report below. You can navigate through the pages in the report by either clicking on the pages listed below, or by using the keyword search tool below to find specific information within the annual report.-
 1
1 -
2
-
3
-
4
-
5
-
6
-
7
-
8
-
9
-
10
-
11
-
12
-
13
-
14
-
15
-
16
-
17
-
18
-
19
-
20
-
21
-
22
-
23
-
24
-
25
-
26
-
27
-
28
-
29
-
30
-
31
-
32
-
33
-
34
-
35
-
36
-
37
-
38
-
39
-
40
-
41
-
42
-
43
-
44
-
45
-
46
-
47
-
48
-
49
-
50
-
51
-
52
-
53
-
54
-
55
-
56
-
57
-
58
-
59
-
60
-
61
-
62
-
 63
63 -
 64
64 -
 65
65 -
 66
66 -
 67
67 -
 68
68 -
 69
69 -
 70
70 -
 71
71 -
 72
72 -
 73
73 -
 74
74 -
 75
75 -
 76
76 -
 77
77 -
 78
78 -
 79
79 -
 80
80 -
 81
81 -
 82
82 -
 83
83 -
84
-
85
-
86
-
87
-
88
-
89
-
90
-
91
-
92
-
93
-
94
-
95
-
96
-
97
-
98
-
99
-
100
-
101
-
102
-
103
-
104
-
105
-
106
-
107
-
108
-
109
-
110
-
111
-
112
-
113
-
114
-
115
-
116
-
117
-
118
-
119
-
120
-
121
-
122
-
123
-
124
-
125
-
126
-
127
-
128
-
129
-
130
-
131
-
132
-
133
-
134
-
135
-
136
-
137
-
138
-
139
-
140
-
141
-
142
 |
 |
A-8
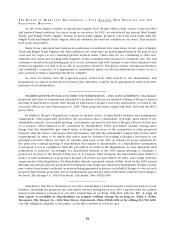
to Kroger’s charitable foundation will enable it to continue to support causes such as hunger relief, breast
cancer awareness, the military and their families and local community organizations. Our net earnings for
2013 include a net benefit of $23 million, which includes benefits from certain tax items of $40 million, offset
partially by costs of $11 million in interest and $16 million in OG&A expenses ($17 million after-tax) related
to our merger with Harris Teeter (“2013 Adjusted Items”).
Excluding the 2014 Adjusted Items, net earnings for 2014 totaled $1.8 billion, or $3.52 per diluted share,
compared to net earnings in 2013 of $1.5 billion, or $2.85 per diluted share, excluding the 2013 Adjusted
Items. We believe adjusted net earnings and adjusted net earnings per diluted share present a more accurate
year-over-year comparison of our financial results because the Adjusted Items were not the result of our
normal operations. Our adjusted net earnings per diluted share for 2014 represent a 24% increase, compared
to 2013. Please refer to the “Net Earnings” section of MD&A for more information.
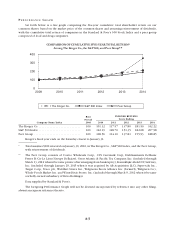
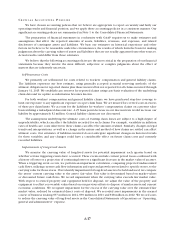
Our identical supermarket sales increased 5.2%, excluding fuel, in 2014, compared to 2013. We have
achieved 45 consecutive quarters of positive identical supermarket sales growth, excluding fuel. As we
continue to outpace many of our competitors on identical supermarket sales growth, we continue to gain
market share. We focus on identical supermarket sales growth, excluding fuel, as it is a key performance target
for our long-term growth strategy.
Increasing market share is an important part of our long-term strategy as it best reflects how our products
and services resonate with customers. Market share growth allows us to spread the fixed costs in our business
over a wider revenue base. Our fundamental operating philosophy is to maintain and increase market share
by offering customers good prices and superior products and service. Based on Nielsen POS+ data, our overall
market share of the products we sell in markets in which we operate increased by approximately 60 basis
points in 2014. This data also indicates that our market share increased in 18 markets and declined slightly in
two. Wal-Mart is one of our top two competitors in 15 of the 20 markets outlined in the Nielson report. Our
market share increased in all 15 of these markets. These market share results reflect our long-term strategy of
market share growth.
RE S U L T S O F O P E R A T I O N S
The following discussion summarizes our operating results for 2014 compared to 2013 and for 2013
compared to 2012. Comparability is affected by income and expense items that fluctuated significantly
between and among the periods, our merger with Harris Teeter in late 2013 and an extra week in 2012.
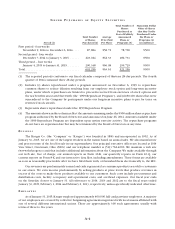
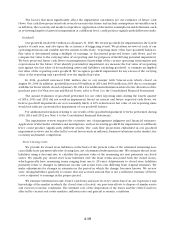
Net Earnings
Net earnings totaled $1.7 billion in 2014 and $1.5 billion in 2013 and 2012. Net earnings improved in
2014, compared to net earnings in 2013, due to an increase in operating profit, partially offset by increases in
interest and tax expense. Operating profit increased in 2014, compared to 2013, primarily due to an increase
in first-in, first-out (“FIFO”) non-fuel gross profit, excluding Harris Teeter, the effect of our merger with Harris
Teeter and an increase in fuel operating profit, partially offset by continued investments in lower prices for
our customers, the 2014 Contributions, an $87 million ($56 million after-tax) charge due to the restructuring
of certain pension plan agreements and a higher LIFO charge which was $147 million (pre-tax), compared
to a LIFO charge of $52 million (pre-tax) in 2013. Net earnings improved in 2013, compared to net earnings
of 2012, due to a decrease in tax and interest expense, partially offset by a decrease in operating profit.
Operating profit decreased in 2013, compared to 2012, primarily due to a 53rd week in fiscal year 2012 (the
“Extra Week”), continued investments in lower prices for our customers, the 2012 settlement with Visa and
MasterCard and the reduction in our obligation to fund the UFCW Consolidated Pension Plan created in 2012,
partially offset by an increase in FIFO non-fuel gross profit.
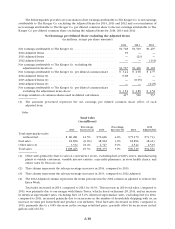
The net earnings for 2014 include a net charge of $39 million, after tax, related to the 2014 Adjusted Items.
The net earnings for 2013 include a net benefit of $23 million, after tax, related to the 2013 Adjusted Items.
The net earnings for 2012 include a benefit from net earnings of approximately $58 million, after-tax, due to
the Extra Week and a net $115 million ($74 million after-tax) benefit in OG&A expenses for the settlement
with Visa and MasterCard and a reduction in our obligation to fund the UFCW Consolidated Pension Plan