Kroger 2014 Annual Report Download - page 132
Download and view the complete annual report
Please find page 132 of the 2014 Kroger annual report below. You can navigate through the pages in the report by either clicking on the pages listed below, or by using the keyword search tool below to find specific information within the annual report.-
 1
1 -
2
-
3
-
4
-
5
-
6
-
7
-
8
-
9
-
10
-
11
-
12
-
13
-
14
-
15
-
16
-
17
-
18
-
19
-
20
-
21
-
22
-
23
-
24
-
25
-
26
-
27
-
28
-
29
-
30
-
31
-
32
-
33
-
34
-
35
-
36
-
37
-
38
-
39
-
40
-
41
-
42
-
43
-
44
-
45
-
46
-
47
-
48
-
49
-
50
-
51
-
52
-
53
-
54
-
55
-
56
-
57
-
58
-
59
-
60
-
61
-
62
-
63
-
64
-
65
-
66
-
67
-
68
-
69
-
70
-
71
-
72
-
73
-
74
-
75
-
76
-
77
-
78
-
79
-
80
-
81
-
82
-
83
-
84
-
85
-
86
-
87
-
88
-
89
-
90
-
91
-
92
-
93
-
94
-
95
-
96
-
97
-
98
-
99
-
100
-
101
-
102
-
103
-
104
-
105
-
106
-
107
-
108
-
109
-
110
-
111
-
112
-
113
-
114
-
115
-
116
-
117
-
118
-
119
-
120
-
121
-
 122
122 -
 123
123 -
 124
124 -
 125
125 -
 126
126 -
 127
127 -
 128
128 -
 129
129 -
 130
130 -
 131
131 -
 132
132 -
 133
133 -
 134
134 -
 135
135 -
 136
136 -
 137
137 -
 138
138 -
 139
139 -
 140
140 -
 141
141 -
 142
142
 |
 |

A-67
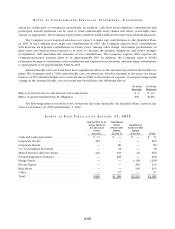
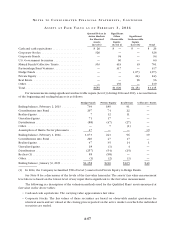
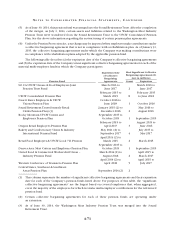
NO T E S T O C O N S O L I D A T E D F I N A N C I A L S T A T E M E N T S , CO N T I N U E D
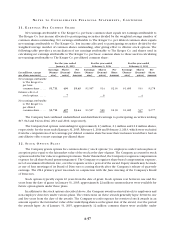
AS S E T S A T F A I R VA L U E A S O F F E B R U A R Y 1 , 2 0 14
Quoted Prices in
Active Markets
for Identical
Assets
(Level 1)
Significant
Other
Observable
Inputs
(Level 2)
Significant
Unobservable
Inputs
(Level 3) Total
Cash and cash equivalents . . . . . . . . . . . . . . . . . . . $ 26 $ — $ — $ 26
Corporate Stocks . . . . . . . . . . . . . . . . . . . . . . . . . . . 326 — — 326
Corporate Bonds . . . . . . . . . . . . . . . . . . . . . . . . . . . — 94 — 94
U.S. Government Securities . . . . . . . . . . . . . . . . . . — 60 — 60
Mutual Funds/Collective Trusts . . . . . . . . . . . . . . . 303 419 39 761
Partnerships/Joint Ventures . . . . . . . . . . . . . . . . . . — 317 — 317
Hedge Funds . . . . . . . . . . . . . . . . . . . . . . . . . . . . . . — — 1,073 1,073
Private Equity . . . . . . . . . . . . . . . . . . . . . . . . . . . . . — — 243 243
Real Estate . . . . . . . . . . . . . . . . . . . . . . . . . . . . . . . . — — 96 96
Other . . . . . . . . . . . . . . . . . . . . . . . . . . . . . . . . . . . . — 139 — 139
Total. . . . . . . . . . . . . . . . . . . . . . . . . . . . . . . . . . . . . $655 $1,029 $1,451 $3,135
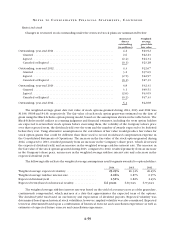
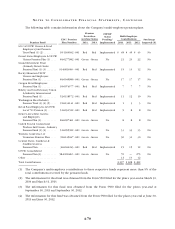
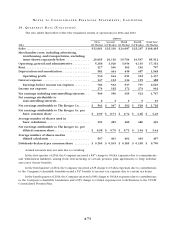
For measurements using significant unobservable inputs (Level 3) during 2014 and 2013, a reconciliation
of the beginning and ending balances is as follows:
Hedge Funds Private Equity Real Estate Collective Trusts
Ending balance, February 2, 2013 . . . . . . . . . 739 180 91 —
Contributions into Fund . . . . . . . . . . . . . . . . . 297 74 22 —
Realized gains . . . . . . . . . . . . . . . . . . . . . . . . . 7 12 11 —
Unrealized gains . . . . . . . . . . . . . . . . . . . . . . . 71 17 — —
Distributions . . . . . . . . . . . . . . . . . . . . . . . . . . (88) (47) (27) —
Other . . . . . . . . . . . . . . . . . . . . . . . . . . . . . . . . — 7 (1) —
Assumption of Harris Teeter plan assets . . . . 47 — — 39
Ending balance, February 1, 2014 . . . . . . . . . . 1,073 243 96 39
Contributions into Fund . . . . . . . . . . . . . . . . . 220 47 17 —
Realized gains . . . . . . . . . . . . . . . . . . . . . . . . . 47 35 14 1
Unrealized gains . . . . . . . . . . . . . . . . . . . . . . . 18 (1) 4 —
Distributions . . . . . . . . . . . . . . . . . . . . . . . . . . (257) (54) (25) —
Reclass (1) . . . . . . . . . . . . . . . . . . . . . . . . . . . . 58 (58) — —
Other . . . . . . . . . . . . . . . . . . . . . . . . . . . . . . . . (1) (2) (1) —
Ending balance, January 31, 2015 . . . . . . . . . . $1,158 $210 $105 $40
(1) In 2014, the Company reclassified $58 of Level 3 assets from Private Equity to Hedge Funds.
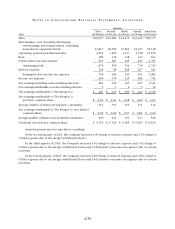
See Note 8 for a discussion of the levels of the fair value hierarchy. The assets’ fair value measurement
level above is based on the lowest level of any input that is significant to the fair value measurement.
The following is a description of the valuation methods used for the Qualified Plans’ assets measured at
fair value in the above tables:
• Cashandcashequivalents:Thecarryingvalueapproximatesfairvalue.
• Corporate Stocks: The fair values of these securities are based on observable market quotations for
identical assets and are valued at the closing price reported on the active market on which the individual
securities are traded.