Kroger 2014 Annual Report Download - page 81
Download and view the complete annual report
Please find page 81 of the 2014 Kroger annual report below. You can navigate through the pages in the report by either clicking on the pages listed below, or by using the keyword search tool below to find specific information within the annual report.-
 1
1 -
2
-
3
-
4
-
5
-
6
-
7
-
8
-
9
-
10
-
11
-
12
-
13
-
14
-
15
-
16
-
17
-
18
-
19
-
20
-
21
-
22
-
23
-
24
-
25
-
26
-
27
-
28
-
29
-
30
-
31
-
32
-
33
-
34
-
35
-
36
-
37
-
38
-
39
-
40
-
41
-
42
-
43
-
44
-
45
-
46
-
47
-
48
-
49
-
50
-
51
-
52
-
53
-
54
-
55
-
56
-
57
-
58
-
59
-
60
-
61
-
62
-
63
-
64
-
65
-
66
-
67
-
68
-
69
-
70
-
 71
71 -
 72
72 -
 73
73 -
 74
74 -
 75
75 -
 76
76 -
 77
77 -
 78
78 -
 79
79 -
 80
80 -
 81
81 -
 82
82 -
 83
83 -
 84
84 -
 85
85 -
 86
86 -
 87
87 -
 88
88 -
 89
89 -
 90
90 -
 91
91 -
92
-
93
-
94
-
95
-
96
-
97
-
98
-
99
-
100
-
101
-
102
-
103
-
104
-
105
-
106
-
107
-
108
-
109
-
110
-
111
-
112
-
113
-
114
-
115
-
116
-
117
-
118
-
119
-
120
-
121
-
122
-
123
-
124
-
125
-
126
-
127
-
128
-
129
-
130
-
131
-
132
-
133
-
134
-
135
-
136
-
137
-
138
-
139
-
140
-
141
-
142
 |
 |

A-16
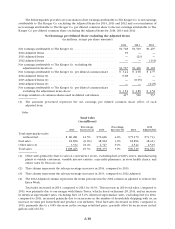
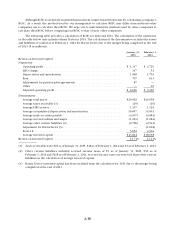
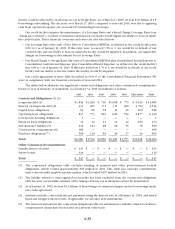
Although ROIC is a relatively standard financial term, numerous methods exist for calculating a company’s
ROIC. As a result, the method used by our management to calculate ROIC may differ from methods other
companies use to calculate their ROIC. We urge you to understand the methods used by other companies to
calculate their ROIC before comparing our ROIC to that of such other companies.
The following table provides a calculation of ROIC for 2014 and 2013. The calculation of the numerator
in the table below only includes Harris Teeter in 2014. The calculation of the denominator excludes the assets
and liabilities recorded as of February 1, 2014 for Harris Teeter due to the merger being completed at the end
of 2013 ($ in millions):
January 31,
2015
February 1,
2014
Return on Invested Capital
Numerator
Operating profit . . . . . . . . . . . . . . . . . . . . . . . . . . . . . . . . . . . . . . . . . . . . . . . . . . $ 3,137 $ 2,725
LIFO charge. . . . . . . . . . . . . . . . . . . . . . . . . . . . . . . . . . . . . . . . . . . . . . . . . . . . . . 147 52
Depreciation and amortization . . . . . . . . . . . . . . . . . . . . . . . . . . . . . . . . . . . . . . . 1,948 1,703
Rent. . . . . . . . . . . . . . . . . . . . . . . . . . . . . . . . . . . . . . . . . . . . . . . . . . . . . . . . . . . . 707 613
Adjustments for pension plan agreements . . . . . . . . . . . . . . . . . . . . . . . . . . . . . . 87 —
Other. . . . . . . . . . . . . . . . . . . . . . . . . . . . . . . . . . . . . . . . . . . . . . . . . . . . . . . . . . . — 16
Adjusted operating profit . . . . . . . . . . . . . . . . . . . . . . . . . . . . . . . . . . . . . . . . . . . $ 6,026 $ 5,109
Denominator
Average total assets . . . . . . . . . . . . . . . . . . . . . . . . . . . . . . . . . . . . . . . . . . . . . . . . $29,919 $26,958
Average taxes receivable (1) . . . . . . . . . . . . . . . . . . . . . . . . . . . . . . . . . . . . . . . . . (19) (10)
Average LIFO reserve . . . . . . . . . . . . . . . . . . . . . . . . . . . . . . . . . . . . . . . . . . . . . . 1,197 1,124
Average accumulated depreciation and amortization. . . . . . . . . . . . . . . . . . . . . . 16,057 14,991
Average trade accounts payable . . . . . . . . . . . . . . . . . . . . . . . . . . . . . . . . . . . . . . (4,967) (4,683)
Average accrued salaries and wages . . . . . . . . . . . . . . . . . . . . . . . . . . . . . . . . . . . (1,221) (1,084)
Average other current liabilities (2) . . . . . . . . . . . . . . . . . . . . . . . . . . . . . . . . . . . (2,780) (2,544)
Adjustment for Harris Teeter (3) . . . . . . . . . . . . . . . . . . . . . . . . . . . . . . . . . . . . . . — (1,618)
Rent x 8. . . . . . . . . . . . . . . . . . . . . . . . . . . . . . . . . . . . . . . . . . . . . . . . . . . . . . . . . 5,656 4,904
Average invested capital . . . . . . . . . . . . . . . . . . . . . . . . . . . . . . . . . . . . . . . . . . . . $43,842 $38,038
Return on Invested Capital . . . . . . . . . . . . . . . . . . . . . . . . . . . . . . . . . . . . . . . . . . . . 13.74% 13.43%
(1) Taxes receivable were $20 as of January 31, 2015, $18 as of February 1, 2014 and $2 as of February 2, 2013.
(2) Other current liabilities included accrued income taxes of $5 as of January 31, 2015, $92 as of
February 1, 2014 and $128 as of February 2, 2013. Accrued income taxes are removed from other current
liabilities in the calculation of average invested capital.
(3) Harris Teeter’s invested capital has been excluded from the calculation for 2013 due to the merger being
completed at the end of 2013.