Kroger 2014 Annual Report Download - page 111
Download and view the complete annual report
Please find page 111 of the 2014 Kroger annual report below. You can navigate through the pages in the report by either clicking on the pages listed below, or by using the keyword search tool below to find specific information within the annual report.-
 1
1 -
2
-
3
-
4
-
5
-
6
-
7
-
8
-
9
-
10
-
11
-
12
-
13
-
14
-
15
-
16
-
17
-
18
-
19
-
20
-
21
-
22
-
23
-
24
-
25
-
26
-
27
-
28
-
29
-
30
-
31
-
32
-
33
-
34
-
35
-
36
-
37
-
38
-
39
-
40
-
41
-
42
-
43
-
44
-
45
-
46
-
47
-
48
-
49
-
50
-
51
-
52
-
53
-
54
-
55
-
56
-
57
-
58
-
59
-
60
-
61
-
62
-
63
-
64
-
65
-
66
-
67
-
68
-
69
-
70
-
71
-
72
-
73
-
74
-
75
-
76
-
77
-
78
-
79
-
80
-
81
-
82
-
83
-
84
-
85
-
86
-
87
-
88
-
89
-
90
-
91
-
92
-
93
-
94
-
95
-
96
-
97
-
98
-
99
-
100
-
 101
101 -
 102
102 -
 103
103 -
 104
104 -
 105
105 -
 106
106 -
 107
107 -
 108
108 -
 109
109 -
 110
110 -
 111
111 -
 112
112 -
 113
113 -
 114
114 -
 115
115 -
 116
116 -
 117
117 -
 118
118 -
 119
119 -
 120
120 -
 121
121 -
122
-
123
-
124
-
125
-
126
-
127
-
128
-
129
-
130
-
131
-
132
-
133
-
134
-
135
-
136
-
137
-
138
-
139
-
140
-
141
-
142
 |
 |

A-46
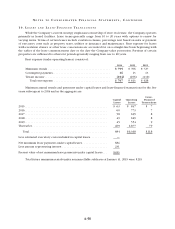
NO T E S T O C O N S O L I D A T E D F I N A N C I A L S T A T E M E N T S , CO N T I N U E D
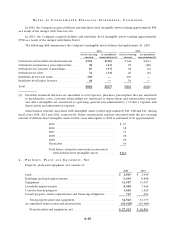
Accumulated depreciation and amortization for leased property under capital leases was $332 at
January 31, 2015 and $339 at February 1, 2014.
Approximately $260 and $175, net book value, of property, plant and equipment collateralized certain
mortgages at January 31, 2015 and February 1, 2014, respectively.
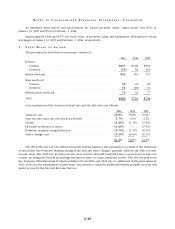
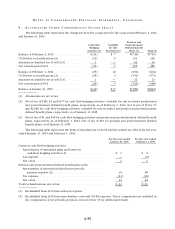
5 . T A X E S B A S E D O N I N C O M E
The provision for taxes based on income consists of:
2014 2013 2012
Federal
Current ................................................ $847 $638 $563
Deferred ............................................... (15) 81 154
Subtotal federal ............................................ 832 719 717
State and local
Current ................................................ 59 42 46
Deferred ............................................... 11 (10) 31
Subtotal state and local ...................................... 70 32 77
Total . . . . . . . . . . . . . . . . . . . . . . . . . . . . . . . . . . . . . . . . . . . . . . . . . . . . . $902 $751 $794
A reconciliation of the statutory federal rate and the effective rate follows:
2014 2013 2012
Statutory rate ........................................... 35.0% 35.0% 35.0%
State income taxes, net of federal tax benefit .................. 1.7% 0.9% 2.2%
Credits ................................................ (1.2)% (1.3)% (1.4)%
Favorable resolution of issues .............................. (0.4)% — (0.5)%
Domestic manufacturing deduction ......................... (0.7)% (1.1)% (0.5)%
Other changes, net....................................... (0.3)% (0.6)% (0.3)%
34.1% 32.9% 34.5%
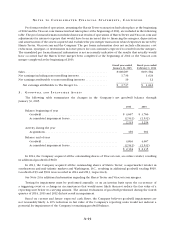
The 2014 effective tax rate differed from the federal statutory rate primarily as a result of the utilization
of tax credits, the Domestic Manufacturing Deduction and other changes, partially offset by the effect of state
income taxes. The 2013 rate for state income taxes is lower than 2014 and 2012 due to an increase in state tax
credits, including the benefit from filing amended returns to claim additional credits. The 2013 benefit from
the Domestic Manufacturing Deduction differed from 2014 and 2012 due to additional deductions taken in
2013, as well as the amendment of prior years’ tax returns to claim the additional benefit available in years still
under review by the Internal Revenue Service.