Kroger 2014 Annual Report Download - page 106
Download and view the complete annual report
Please find page 106 of the 2014 Kroger annual report below. You can navigate through the pages in the report by either clicking on the pages listed below, or by using the keyword search tool below to find specific information within the annual report.-
 1
1 -
2
-
3
-
4
-
5
-
6
-
7
-
8
-
9
-
10
-
11
-
12
-
13
-
14
-
15
-
16
-
17
-
18
-
19
-
20
-
21
-
22
-
23
-
24
-
25
-
26
-
27
-
28
-
29
-
30
-
31
-
32
-
33
-
34
-
35
-
36
-
37
-
38
-
39
-
40
-
41
-
42
-
43
-
44
-
45
-
46
-
47
-
48
-
49
-
50
-
51
-
52
-
53
-
54
-
55
-
56
-
57
-
58
-
59
-
60
-
61
-
62
-
63
-
64
-
65
-
66
-
67
-
68
-
69
-
70
-
71
-
72
-
73
-
74
-
75
-
76
-
77
-
78
-
79
-
80
-
81
-
82
-
83
-
84
-
85
-
86
-
87
-
88
-
89
-
90
-
91
-
92
-
93
-
94
-
95
-
 96
96 -
 97
97 -
 98
98 -
 99
99 -
 100
100 -
 101
101 -
 102
102 -
 103
103 -
 104
104 -
 105
105 -
 106
106 -
 107
107 -
 108
108 -
 109
109 -
 110
110 -
 111
111 -
 112
112 -
 113
113 -
 114
114 -
 115
115 -
 116
116 -
117
-
118
-
119
-
120
-
121
-
122
-
123
-
124
-
125
-
126
-
127
-
128
-
129
-
130
-
131
-
132
-
133
-
134
-
135
-
136
-
137
-
138
-
139
-
140
-
141
-
142
 |
 |

A-41
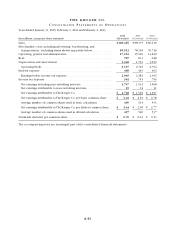
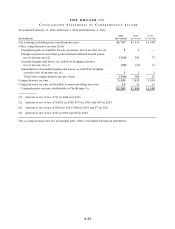
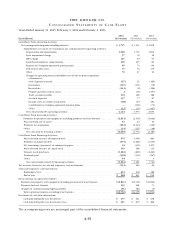
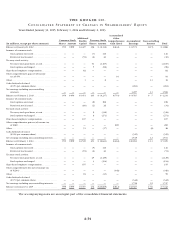
NO T E S T O C O N S O L I D A T E D F I N A N C I A L S T A T E M E N T S , CO N T I N U E D
Consolidated Statements of Cash Flows
For purposes of the Consolidated Statements of Cash Flows, the Company considers all highly liquid debt
instruments purchased with an original maturity of three months or less to be temporary cash investments.
The net increase (decrease) in book overdrafts previously reported in financing activities in the
Consolidated Statements of Cash Flows are now reported within operating activities. Prior year amounts have
been revised to the current year presentation. These revisions were not material to the prior periods.
Segments
The Company operates retail food and drug stores, multi-department stores, jewelry stores, and
convenience stores throughout the United States. The Company’s retail operations, which represent over
99% of the Company’s consolidated sales and EBITDA, are its only reportable segment. The Company’s retail
operating divisions have been aggregated into one reportable segment due to the operating divisions having
similar economic characteristics with similar long-term financial performance. In addition, the Company’s
operating divisions offer to its customers similar products, have similar distribution methods, operate in
similar regulatory environments, purchase the majority of the Company’s merchandise for retail sale from
similar (and in many cases identical) vendors on a coordinated basis from a centralized location, serve similar
types of customers, and are allocated capital from a centralized location. The Company’s operating divisions
reflect the manner in which the business is managed and how the Company’s Chief Executive Officer and
Chief Operating Officer, who act as the Company’s chief operating decision makers, assess performance
internally. All of the Company’s operations are domestic.
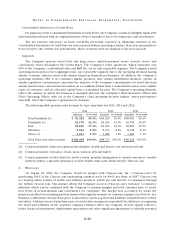
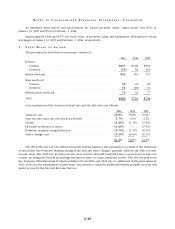
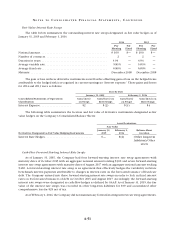
The following table presents sales revenue by type of product for 2014, 2013 and 2012.
2014 2013 2012
Amount % of total Amount % of total Amount % of total
Non Perishable (1) . . . . . . . . . . . . $ 54,392 50.1% $49,229 50.0% $48,663 50.4%
Perishable (2) . . . . . . . . . . . . . . . 24,178 22.3% 20,625 21.0% 19,761 20.5%
Fuel . . . . . . . . . . . . . . . . . . . . . . . 18,850 17.4% 18,962 19.3% 18,896 19.5%
Pharmacy . . . . . . . . . . . . . . . . . . 9,032 8.3% 8,073 8.2% 8,018 8.3%
Other (3) . . . . . . . . . . . . . . . . . . . 2,014 1.9% 1,486 1.5% 1,281 1.3%
Total Sales and other revenue . . . $108,465 100.0% $98,375 100.0% $96,619 100.0%
(1) Consists primarily of grocery, general merchandise, health and beauty care and natural foods.
(2) Consists primarily of produce, floral, meat, seafood, deli and bakery.
(3) Consists primarily of sales related to jewelry stores, manufacturing plants to outside customers, variable
interest entities, a specialty pharmacy, in-store health clinics and online sales by Vitacost.com.
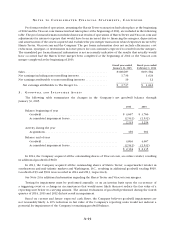
2 . M E R G E R S
On August 18, 2014, the Company closed its merger with Vitacost.com, Inc. (“Vitacost.com”) by
purchasing 100% of the Vitacost.com outstanding common stock for $8.00 per share or $287. Vitacost.com
is a leading online retailer of health and wellness products, which are sold directly to consumers through
the website vitacost.com. This merger affords the Company access to Vitacost.com’s extensive e-commerce
platform, which can be combined with the Company’s customer insights and loyal customer base, to create
new levels of personalization and convenience for customers. The merger was accounted for under the
purchase method of accounting and was financed through the issuance of commercial paper (see Note 6). In a
business combination, the purchase price is allocated to assets acquired and liabilities assumed based on their
fair values, with any excess of purchase price over fair value recognized as goodwill. In addition to recognizing
the assets and liabilities on the acquired company’s balance sheet, the Company reviews supply contracts,
leases, financial instruments, employment agreements and other significant agreements to identify potential