Kroger 2014 Annual Report Download - page 80
Download and view the complete annual report
Please find page 80 of the 2014 Kroger annual report below. You can navigate through the pages in the report by either clicking on the pages listed below, or by using the keyword search tool below to find specific information within the annual report.-
 1
1 -
2
-
3
-
4
-
5
-
6
-
7
-
8
-
9
-
10
-
11
-
12
-
13
-
14
-
15
-
16
-
17
-
18
-
19
-
20
-
21
-
22
-
23
-
24
-
25
-
26
-
27
-
28
-
29
-
30
-
31
-
32
-
33
-
34
-
35
-
36
-
37
-
38
-
39
-
40
-
41
-
42
-
43
-
44
-
45
-
46
-
47
-
48
-
49
-
50
-
51
-
52
-
53
-
54
-
55
-
56
-
57
-
58
-
59
-
60
-
61
-
62
-
63
-
64
-
65
-
66
-
67
-
68
-
69
-
 70
70 -
 71
71 -
 72
72 -
 73
73 -
 74
74 -
 75
75 -
 76
76 -
 77
77 -
 78
78 -
 79
79 -
 80
80 -
 81
81 -
 82
82 -
 83
83 -
 84
84 -
 85
85 -
 86
86 -
 87
87 -
 88
88 -
 89
89 -
 90
90 -
91
-
92
-
93
-
94
-
95
-
96
-
97
-
98
-
99
-
100
-
101
-
102
-
103
-
104
-
105
-
106
-
107
-
108
-
109
-
110
-
111
-
112
-
113
-
114
-
115
-
116
-
117
-
118
-
119
-
120
-
121
-
122
-
123
-
124
-
125
-
126
-
127
-
128
-
129
-
130
-
131
-
132
-
133
-
134
-
135
-
136
-
137
-
138
-
139
-
140
-
141
-
142
 |
 |

A-15
The shares repurchased in 2014 were acquired under three separate share repurchase programs. The first
is a $500 million repurchase program that was authorized by our Board of Directors on October 16, 2012. The
second is a $1 billion repurchase program that was authorized by our Board of Directors on March 13, 2014,
that replaced the first referenced program. The third is a program that uses the cash proceeds from the
exercises of stock options by participants in our stock option and long-term incentive plans as well as the
associated tax benefits. On June 26, 2014, we announced a new $500 million share repurchase program that
was authorized by our Board of Directors, replacing the $1 billion repurchase program that was authorized by
our Board of Directors on March 13, 2014. As of January 31, 2015, we have not repurchased any shares utilizing
the June 26, 2014 repurchase program.
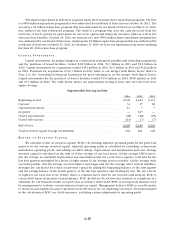
CA P I T A L I N V E S T M E N T S
Capital investments, including changes in construction-in-progress payables and excluding acquisitions
and the purchase of leased facilities, totaled $2.8 billion in 2014, $2.3 billion in 2013 and $2.0 billion in
2012. Capital investments for acquisitions totaled $252 million in 2014, $2.3 billion in 2013 and $122 million
in 2012. Payments for acquisitions of $2.3 billion in 2013 relate to our merger with Harris Teeter. Refer to
Note 2 to the Consolidated Financial Statements for more information on the merger with Harris Teeter.
Capital investments for the purchase of leased facilities totaled $135 million in 2014, $108 million in 2013
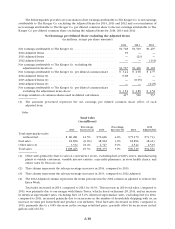
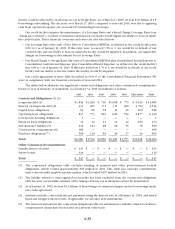
and $73 million in 2012. The table below shows our supermarket storing activity and our total food store
square footage:
Supermarket Storing Activity
2014 2013 2012
Beginning of year. . . . . . . . . . . . . . . . . . . . . . . . . . . . . . . . . . . . . . . . . . . . . . . . . . 2,640 2,424 2,435
Opened. . . . . . . . . . . . . . . . . . . . . . . . . . . . . . . . . . . . . . . . . . . . . . . . . . . . . . . . . . 33 17 18
Opened (relocation). . . . . . . . . . . . . . . . . . . . . . . . . . . . . . . . . . . . . . . . . . . . . . . . 13 7 7
Acquired. . . . . . . . . . . . . . . . . . . . . . . . . . . . . . . . . . . . . . . . . . . . . . . . . . . . . . . . . — 227 —
Closed (operational) . . . . . . . . . . . . . . . . . . . . . . . . . . . . . . . . . . . . . . . . . . . . . . . (48) (28) (29)
Closed (relocation). . . . . . . . . . . . . . . . . . . . . . . . . . . . . . . . . . . . . . . . . . . . . . . . . (13) (7) (7)
End of year . . . . . . . . . . . . . . . . . . . . . . . . . . . . . . . . . . . . . . . . . . . . . . . . . . . . . . . 2,625 2,640 2,424
Total food store square footage (in millions) . . . . . . . . . . . . . . . . . . . . . . . . . . . . 162 161 149
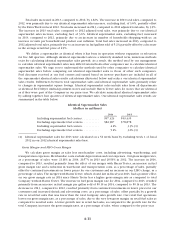
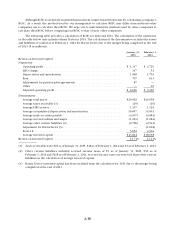
RE T U R N O N I N V E S T E D C A P I T A L
We calculate return on invested capital (“ROIC”) by dividing adjusted operating profit for the prior four
quarters by the average invested capital. Adjusted operating profit is calculated by excluding certain items
included in operating profit, and adding our LIFO charge, depreciation and amortization and rent. Average
invested capital is calculated as the sum of (i) the average of our total assets, (ii) the average LIFO reserve,
(iii) the average accumulated depreciation and amortization and (iv) a rent factor equal to total rent for the
last four quarters multiplied by a factor of eight; minus (i) the average taxes receivable, (ii) the average trade
accounts payable, (iii) the average accrued salaries and wages and (iv) the average other current liabilities.
Averages are calculated for return on invested capital by adding the beginning balance of the first quarter
and the ending balance of the fourth quarter, of the last four quarters, and dividing by two. We use a factor
of eight for our total rent as we believe this is a common factor used by our investors and analysts. ROIC is
a non-GAAP financial measure of performance. ROIC should not be reviewed in isolation or considered as a
substitute for our financial results as reported in accordance with GAAP. ROIC is an important measure used
by management to evaluate our investment returns on capital. Management believes ROIC is a useful metric
to investors and analysts because it measures how effectively we are deploying our assets. All items included
in the calculation of ROIC are GAAP measures, excluding certain adjustments to operating profit.