Kroger 2014 Annual Report Download - page 74
Download and view the complete annual report
Please find page 74 of the 2014 Kroger annual report below. You can navigate through the pages in the report by either clicking on the pages listed below, or by using the keyword search tool below to find specific information within the annual report.-
 1
1 -
2
-
3
-
4
-
5
-
6
-
7
-
8
-
9
-
10
-
11
-
12
-
13
-
14
-
15
-
16
-
17
-
18
-
19
-
20
-
21
-
22
-
23
-
24
-
25
-
26
-
27
-
28
-
29
-
30
-
31
-
32
-
33
-
34
-
35
-
36
-
37
-
38
-
39
-
40
-
41
-
42
-
43
-
44
-
45
-
46
-
47
-
48
-
49
-
50
-
51
-
52
-
53
-
54
-
55
-
56
-
57
-
58
-
59
-
60
-
61
-
62
-
63
-
 64
64 -
 65
65 -
 66
66 -
 67
67 -
 68
68 -
 69
69 -
 70
70 -
 71
71 -
 72
72 -
 73
73 -
 74
74 -
 75
75 -
 76
76 -
 77
77 -
 78
78 -
 79
79 -
 80
80 -
 81
81 -
 82
82 -
 83
83 -
 84
84 -
85
-
86
-
87
-
88
-
89
-
90
-
91
-
92
-
93
-
94
-
95
-
96
-
97
-
98
-
99
-
100
-
101
-
102
-
103
-
104
-
105
-
106
-
107
-
108
-
109
-
110
-
111
-
112
-
113
-
114
-
115
-
116
-
117
-
118
-
119
-
120
-
121
-
122
-
123
-
124
-
125
-
126
-
127
-
128
-
129
-
130
-
131
-
132
-
133
-
134
-
135
-
136
-
137
-
138
-
139
-
140
-
141
-
142
 |
 |
A-9
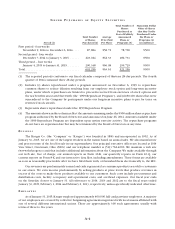
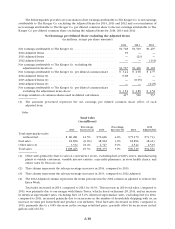
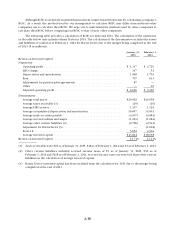
created in January 2012 (“2012 Adjusted Items”). Excluding these benefits and charges for Adjusted Items for
2014, 2013 and 2012, adjusted net earnings were $1.8 billion in 2014, $1.5 billion in 2013 and $1.4 billion in
2012. 2014 adjusted net earnings improved, compared to adjusted net earnings in 2013, due to an increase in
FIFO non-fuel operating profit, excluding Harris Teeter, the effect of our merger with Harris Teeter and an
increase in fuel operating profit, partially offset by continued investments in lower prices for our customers,
increases in interest and tax expense and a higher LIFO charge which was $147 million (pre-tax), compared to
a LIFO charge of $52 million (pre-tax) in 2013. 2013 adjusted net earnings improved, compared to adjusted net
earnings in 2012, due to an increase in FIFO non-fuel operating profit and decreased interest, partially offset
by continued investments in lower prices for our customers and increased tax expense.
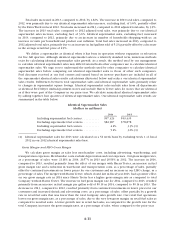
Net earnings per diluted share totaled $3.44 in 2014, $2.90 in 2013 and $2.77 in 2012. Net earnings per
diluted share in 2014, compared to 2013, increased primarily due to fewer shares outstanding as a result of
the repurchase of Kroger common shares and an increase in net earnings. Net earnings per diluted share in
2013, compared to 2012, increased primarily due to fewer shares outstanding as a result of the repurchase of
Kroger common shares and an increase in net earnings.
Excluding the 2014, 2013 and 2012 Adjusted Items, adjusted net earnings per diluted share totaled $3.52
in 2014, $2.85 in 2013 and $2.52 in 2012. Adjusted net earnings per diluted share in 2014, compared to
adjusted net earnings per diluted share in 2013, increased primarily due to fewer shares outstanding as a result
of the repurchase of Kroger common shares and an increase in adjusted net earnings. Adjusted net earnings
per diluted share in 2013, compared to adjusted net earnings per diluted share in 2012, increased primarily
due to fewer shares outstanding as a result of the repurchase of Kroger common shares and an increase in
adjusted net earnings.
Management believes adjusted net earnings (and adjusted net earnings per diluted share) are useful
metrics to investors and analysts because they more accurately reflect our day-to-day business operations
than do the generally accepted accounting principle (“GAAP”) measures of net earnings and net earnings
per diluted share. Adjusted net earnings (and adjusted net earnings per diluted share) are non-generally
accepted accounting principle (“non-GAAP”) financial measures and should not be considered alternatives
to net earnings (and net earnings per diluted share) or any other GAAP measure of performance. Adjusted
net earnings (and adjusted net earnings per diluted share) should not be viewed in isolation or considered
substitutes for our financial results as reported in accordance with GAAP. Management uses adjusted net
earnings (and adjusted net earnings per diluted share) in evaluating our results of operations as it believes
these measures are more meaningful indicators of operating performance since, as adjusted, those earnings
relate more directly to our day-to-day operations. Management also uses adjusted net earnings (and adjusted
net earnings per diluted share) as a performance metric for management incentive programs, and to measure
our progress against internal budgets and targets.