Kroger 2014 Annual Report Download - page 76
Download and view the complete annual report
Please find page 76 of the 2014 Kroger annual report below. You can navigate through the pages in the report by either clicking on the pages listed below, or by using the keyword search tool below to find specific information within the annual report.-
 1
1 -
2
-
3
-
4
-
5
-
6
-
7
-
8
-
9
-
10
-
11
-
12
-
13
-
14
-
15
-
16
-
17
-
18
-
19
-
20
-
21
-
22
-
23
-
24
-
25
-
26
-
27
-
28
-
29
-
30
-
31
-
32
-
33
-
34
-
35
-
36
-
37
-
38
-
39
-
40
-
41
-
42
-
43
-
44
-
45
-
46
-
47
-
48
-
49
-
50
-
51
-
52
-
53
-
54
-
55
-
56
-
57
-
58
-
59
-
60
-
61
-
62
-
63
-
64
-
65
-
 66
66 -
 67
67 -
 68
68 -
 69
69 -
 70
70 -
 71
71 -
 72
72 -
 73
73 -
 74
74 -
 75
75 -
 76
76 -
 77
77 -
 78
78 -
 79
79 -
 80
80 -
 81
81 -
 82
82 -
 83
83 -
 84
84 -
 85
85 -
 86
86 -
87
-
88
-
89
-
90
-
91
-
92
-
93
-
94
-
95
-
96
-
97
-
98
-
99
-
100
-
101
-
102
-
103
-
104
-
105
-
106
-
107
-
108
-
109
-
110
-
111
-
112
-
113
-
114
-
115
-
116
-
117
-
118
-
119
-
120
-
121
-
122
-
123
-
124
-
125
-
126
-
127
-
128
-
129
-
130
-
131
-
132
-
133
-
134
-
135
-
136
-
137
-
138
-
139
-
140
-
141
-
142
 |
 |

A-11
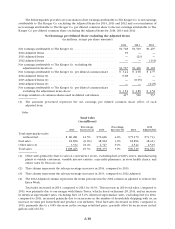
Total sales increased in 2013, compared to 2012, by 1.82%. The increase in 2013 total sales, compared to
2012, was primarily due to our identical supermarket sales increase, excluding fuel, of 3.6%, partially offset
by the Extra Week in fiscal 2012. Total sales increased in 2013, compared to 2012 adjusted total sales, by 3.9%.
The increase in 2013 total sales, compared to 2012 adjusted total sales, was primarily due to our identical
supermarket sales increase, excluding fuel, of 3.6%. Identical supermarket sales, excluding fuel, increased
in 2013, compared to 2012, primarily due to an increase in number of households shopping with us, an
increase in visits per household and product cost inflation. Total fuel sales increased in 2013, compared to
2012 adjusted total sales, primarily due to an increase in fuel gallons sold of 5.2% partially offset by a decrease
in the average retail fuel price of 2.9%.
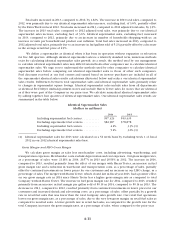
We define a supermarket as identical when it has been in operation without expansion or relocation
for five full quarters. Although identical supermarket sales is a relatively standard term, numerous methods
exist for calculating identical supermarket sales growth. As a result, the method used by our management
to calculate identical supermarket sales may differ from methods other companies use to calculate identical
supermarket sales. We urge you to understand the methods used by other companies to calculate identical
supermarket sales before comparing our identical supermarket sales to those of other such companies.
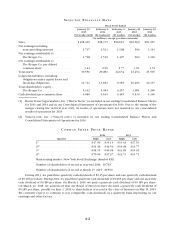
Fuel discounts received at our fuel centers and earned based on in-store purchases are included in all of
the supermarket identical sales results calculations illustrated below and reduce our identical supermarket
sales results. Differences between total supermarket sales and identical supermarket sales primarily relate
to changes in supermarket square footage. Identical supermarket sales include sales from all departments
at identical Fred Meyer multi-department stores and include Harris Teeter sales for stores that are identical
as if they were part of the Company in our prior year. We calculate annualized identical supermarket sales
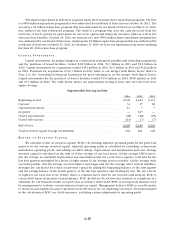
by adding together four quarters of identical supermarket sales. Our identical supermarket sales results are
summarized in the table below.
Identical Supermarket Sales
(dollars in millions)
2014 2013
Including supermarket fuel centers . . . . . . . . . . . $97,323 $93,435
Excluding supermarket fuel centers . . . . . . . . . . . $82,987 $78,878
Including supermarket fuel centers . . . . . . . . . . . 4.2% 3.3% (1)
Excluding supermarket fuel centers . . . . . . . . . . . 5.2% 3.6% (1)
(1) Identical supermarket sales for 2013 were calculated on a 52 week basis by excluding week 1 of fiscal
2012 in our 2012 identical supermarket sales base.
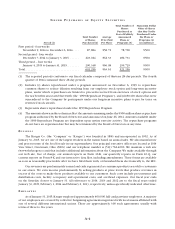
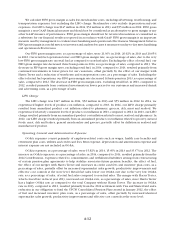
Gross Margin and FIFO Gross Margin
We calculate gross margin as sales less merchandise costs, including advertising, warehousing, and
transportation expenses. Merchandise costs exclude depreciation and rent expenses. Our gross margin rates,
as a percentage of sales, were 21.16% in 2014, 20.57% in 2013 and 20.59% in 2012. The increase in 2014,
compared to 2013, resulted primarily from the effect of our merger with Harris Teeter, an increase in fuel
gross margin rate and a reduction in warehouse and transportation costs, as a percentage of sales, partially
offset by continued investments in lower prices for our customers and an increase in our LIFO charge, as a
percentage of sales. The merger with Harris Teeter, which closed late in fiscal year 2013, had a positive effect
on our gross margin rate in 2014 since Harris Teeter has a higher gross margin rate as compared to total
Company without Harris Teeter. The increase in fuel gross margin rate for 2014, compared to 2013, resulted
primarily from an increase in fuel margin per gallon sold of $0.19 in 2014, compared to $0.14 in 2013. The
decrease in 2013, compared to 2012, resulted primarily from continued investments in lower prices for our
customers and increased shrink and advertising costs, as a percentage of sales, offset partially by a growth
rate in retail fuel sales that was lower than the total Company sales growth rate. Our retail fuel operations
lower our gross margin rate, as a percentage of sales, due to the very low gross margin on retail fuel sales as
compared to non-fuel sales. A lower growth rate in retail fuel sales, as compared to the growth rate for the
total Company, increases the gross margin rates, as a percentage of sales, when compared to the prior year.