Kroger 2014 Annual Report Download - page 77
Download and view the complete annual report
Please find page 77 of the 2014 Kroger annual report below. You can navigate through the pages in the report by either clicking on the pages listed below, or by using the keyword search tool below to find specific information within the annual report.-
 1
1 -
2
-
3
-
4
-
5
-
6
-
7
-
8
-
9
-
10
-
11
-
12
-
13
-
14
-
15
-
16
-
17
-
18
-
19
-
20
-
21
-
22
-
23
-
24
-
25
-
26
-
27
-
28
-
29
-
30
-
31
-
32
-
33
-
34
-
35
-
36
-
37
-
38
-
39
-
40
-
41
-
42
-
43
-
44
-
45
-
46
-
47
-
48
-
49
-
50
-
51
-
52
-
53
-
54
-
55
-
56
-
57
-
58
-
59
-
60
-
61
-
62
-
63
-
64
-
65
-
66
-
 67
67 -
 68
68 -
 69
69 -
 70
70 -
 71
71 -
 72
72 -
 73
73 -
 74
74 -
 75
75 -
 76
76 -
 77
77 -
 78
78 -
 79
79 -
 80
80 -
 81
81 -
 82
82 -
 83
83 -
 84
84 -
 85
85 -
 86
86 -
 87
87 -
88
-
89
-
90
-
91
-
92
-
93
-
94
-
95
-
96
-
97
-
98
-
99
-
100
-
101
-
102
-
103
-
104
-
105
-
106
-
107
-
108
-
109
-
110
-
111
-
112
-
113
-
114
-
115
-
116
-
117
-
118
-
119
-
120
-
121
-
122
-
123
-
124
-
125
-
126
-
127
-
128
-
129
-
130
-
131
-
132
-
133
-
134
-
135
-
136
-
137
-
138
-
139
-
140
-
141
-
142
 |
 |
A-12
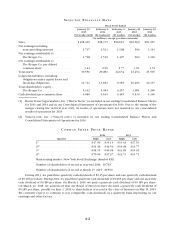
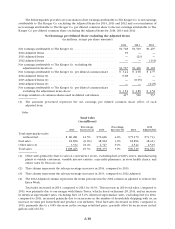
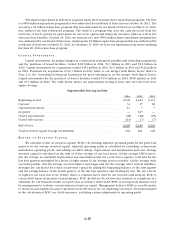
We calculate FIFO gross margin as sales less merchandise costs, including advertising, warehousing, and
transportation expenses, but excluding the LIFO charge. Merchandise costs exclude depreciation and rent
expenses. Our LIFO charge was $147 million in 2014, $52 million in 2013 and $55 million in 2012. FIFO gross
margin is a non-GAAP financial measure and should not be considered as an alternative to gross margin or any
other GAAP measure of performance. FIFO gross margin should not be reviewed in isolation or considered as
a substitute for our financial results as reported in accordance with GAAP. FIFO gross margin is an important
measure used by management to evaluate merchandising and operational effectiveness. Management believes
FIFO gross margin is a useful metric to investors and analysts because it measures our day-to-day merchandising
and operational effectiveness.
Our FIFO gross margin rates, as a percentage of sales, were 21.30% in 2014, 20.62% in 2013 and 20.65%
in 2012. Our retail fuel operations lower our FIFO gross margin rate, as a percentage of sales, due to the very
low FIFO gross margin rate on retail fuel as compared to non-fuel sales. Excluding the effect of retail fuel, our
FIFO gross margin rate decreased three basis points in 2014, as a percentage of sales, compared to 2013. The
decrease in FIFO gross margin rates, excluding retail fuel, in 2014, compared to 2013, resulted primarily from
continued investments in lower prices for our customers, offset partially by the effect of our merger with
Harris Teeter and a reduction of warehouse and transportation costs, as a percentage of sales. Excluding the
effect of retail fuel operations, our FIFO gross margin rate decreased 14 basis points in 2013, as a percentage of
sales, compared to 2012. The decrease in FIFO gross margin rates, excluding retail fuel, in 2013, compared to
2012, resulted primarily from continued investments in lower prices for our customers and increased shrink
and advertising costs, as a percentage of sales.
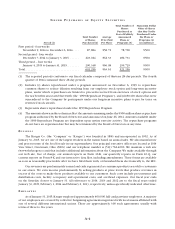
LIFO Charge
The LIFO charge was $147 million in 2014, $52 million in 2013 and $55 million in 2012. In 2014, we
experienced higher levels of product cost inflation, compared to 2013. In 2014, our LIFO charge primarily
resulted from annualized product cost inflation related to pharmacy, grocery, deli, meat and seafood. We
experienced relatively consistent levels of product cost inflation in 2013, compared to 2012. In 2013, our LIFO
charge resulted primarily from an annualized product cost inflation related to meat, seafood and pharmacy. In
2012, our LIFO charge resulted primarily from an annualized product cost inflation related to grocery, natural
foods, meat, deli and bakery, general merchandise and grocery, partially offset by deflation in seafood and
manufactured product.
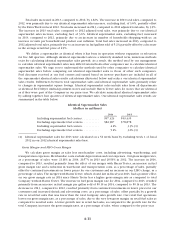
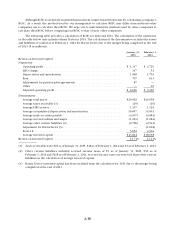
Operating, General and Administrative Expenses
OG&A expenses consist primarily of employee-related costs such as wages, health care benefits and
retirement plan costs, utilities and credit card fees. Rent expense, depreciation and amortization expense and
interest expense are not included in OG&A.
OG&A expenses, as a percentage of sales, were 15.82% in 2014, 15.45% in 2013 and 15.37% in 2012. The
increase in OG&A expenses, as a percentage of sales, in 2014, compared to 2013, resulted primarily from the
2014 Contributions, expenses related to commitments and withdrawal liabilities arising from restructuring
of certain pension plan agreements to help stabilize associates future pension benefits, the effect of fuel,
the effect of our merger with Harris Teeter and increases in credit card fees and incentive plan costs, as a
percentage of sales, partially offset by increased supermarket sales growth, productivity improvements and
effective cost controls at the store level. Retail fuel sales lower our OG&A rate due to the very low OG&A
rate, as a percentage of sales, of retail fuel sales compared to non-fuel sales. The merger with Harris Teeter,
which closed late in fiscal year 2013, increased our OG&A rate, as a percentage of sales, since Harris Teeter
has a higher OG&A rate as compared to the total Company without Harris Teeter. The increase in OG&A
rate in 2013, compared to 2012, resulted primarily from the 2012 settlement with Visa and MasterCard and a
reduction in our obligation to fund the UFCW Consolidated Pension Plan created in January 2012, the effect
of fuel and increased incentive plan costs, as a percentage of sales, offset partially by increased identical
supermarket sales growth, productivity improvements and effective cost controls at the store level.