Kroger 2014 Annual Report Download - page 129
Download and view the complete annual report
Please find page 129 of the 2014 Kroger annual report below. You can navigate through the pages in the report by either clicking on the pages listed below, or by using the keyword search tool below to find specific information within the annual report.-
 1
1 -
2
-
3
-
4
-
5
-
6
-
7
-
8
-
9
-
10
-
11
-
12
-
13
-
14
-
15
-
16
-
17
-
18
-
19
-
20
-
21
-
22
-
23
-
24
-
25
-
26
-
27
-
28
-
29
-
30
-
31
-
32
-
33
-
34
-
35
-
36
-
37
-
38
-
39
-
40
-
41
-
42
-
43
-
44
-
45
-
46
-
47
-
48
-
49
-
50
-
51
-
52
-
53
-
54
-
55
-
56
-
57
-
58
-
59
-
60
-
61
-
62
-
63
-
64
-
65
-
66
-
67
-
68
-
69
-
70
-
71
-
72
-
73
-
74
-
75
-
76
-
77
-
78
-
79
-
80
-
81
-
82
-
83
-
84
-
85
-
86
-
87
-
88
-
89
-
90
-
91
-
92
-
93
-
94
-
95
-
96
-
97
-
98
-
99
-
100
-
101
-
102
-
103
-
104
-
105
-
106
-
107
-
108
-
109
-
110
-
111
-
112
-
113
-
114
-
115
-
116
-
117
-
118
-
 119
119 -
 120
120 -
 121
121 -
 122
122 -
 123
123 -
 124
124 -
 125
125 -
 126
126 -
 127
127 -
 128
128 -
 129
129 -
 130
130 -
 131
131 -
 132
132 -
 133
133 -
 134
134 -
 135
135 -
 136
136 -
 137
137 -
 138
138 -
 139
139 -
140
-
141
-
142
 |
 |

A-64
NO T E S T O C O N S O L I D A T E D F I N A N C I A L S T A T E M E N T S , CO N T I N U E D
The Company’s discount rate assumptions were intended to reflect the rates at which the pension
benefits could be effectively settled. They take into account the timing and amount of benefits that would be
available under the plans. The Company’s policy is to match the plan’s cash flows to that of a hypothetical
bond portfolio whose cash flow from coupons and maturities match the plan’s projected benefit cash flows.
The discount rates are the single rates that produce the same present value of cash flows. The selection of the
3.87% and 3.74% discount rates as of year-end 2014 for pension and other benefits, respectively, represents
the hypothetical bond portfolio using bonds with an AA or better rating constructed with the assistance of
an outside consultant. A 100 basis point increase in the discount rate would decrease the projected pension
benefit obligation as of February 1, 2015, by approximately $500.
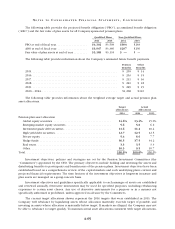
To determine the expected rate of return on pension plan assets held by the Company for 2014, the
Company considered current and forecasted plan asset allocations as well as historical and forecasted rates
of return on various asset categories. In 2014, the Company decreased the assumed pension plan investment
return rate to 7.44% compared to 8.50% in 2013 and 2012. The Company pension plan’s average rate of return
was 7.58% for the 10 calendar years ended December 31, 2014, net of all investment management fees and
expenses. The value of all investments in the Qualified Plans during the calendar year ending December 31,
2014 increased 5.65%, net of investment management fees and expenses. For the past 20 years, the Company’s
average annual rate of return has been 9.58%. Based on the above information and forward looking assumptions
for investments made in a manner consistent with the Company’s target allocations, the Company believes a
7.44% rate of return assumption is reasonable.
The Company calculates its expected return on plan assets by using the market-related value of plan
assets. The market-related value of plan assets is determined by adjusting the actual fair value of plan assets for
gains or losses on plan assets. Gains or losses represent the difference between actual and expected returns
on plan investments for each plan year. Gains or losses on plan assets are recognized evenly over a five year
period. Using a different method to calculate the market-related value of plan assets would provide a different
expected return on plan assets.
On January 31, 2015, the Company adopted new mortality tables based on mortality experience and
assumptions for generational mortality improvement in calculating the Company’s 2014 year end Company
sponsored benefit plans obligations. The tables assume an improvement in life expectancy and increase our
current year benefit obligation and future expenses. The Company used the RP-2000 projected 2021 mortality
table in calculating the Company’s 2013 year end Company sponsored benefit plans obligations and 2014,
2013 and 2012 Company-sponsored benefit plans expenses.
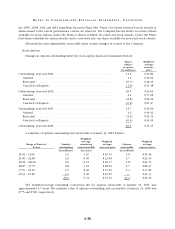
The funded status decreased in 2014, compared to 2013, due primarily to the decrease in the discount
rate, a change in the mortality assumptions and the return on plan assets.
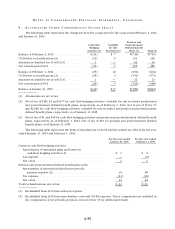
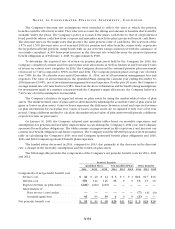
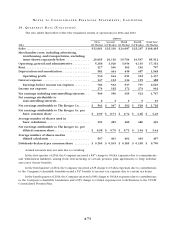
The following table provides the components of the Company’s net periodic benefit costs for 2014, 2013
and 2012:
Pension Benefits
Qualified Plans Non-Qualified Plans Other Benefits
2014 2013 2012 2014 2013 2012 2014 2013 2012
Components of net periodic benefit cost:
Service cost. . . . . . . . . . . . . . . . . . . . . . . . . $ 48 $ 40 $ 44 $ 3 $ 3 $ 3 $11 $17 $16
Interest cost . . . . . . . . . . . . . . . . . . . . . . . . 169 144 146 13 9 9 13 15 16
Expected return on plan assets. . . . . . . . . . (228) (224) (210) — — — — — —
Amortization of:
Prior service cost (credit) . . . . . . . . . . . — — — — — — (7) (4) (4)
Actuarial (gain) loss . . . . . . . . . . . . . . . . 46 93 88 4 9 9 (8) — —
Net periodic benefit cost . . . . . . . . . . . . . . . . . $ 35 $ 53 $ 68 $20 $21 $21 $ 9 $28 $28